
@TDAM_Canada
Investor Knowledge + 5 Minutes = Current Insights
There is an often-ignored cognitive bias that needs to be addressed in today's investing environment. Recency bias is a tendency that causes people to think that because certain events happened recently, they are likely to reoccur in the future. Interestingly, this bias can be observed in the investment industry ranging from novice investors all the way to professionals.
For example, a do-it-yourself (DYI) investor may follow a recent hot trend with the expectation that it will continue. This bias can also work against investment professionals when analyzing recent data to make investment decisions and not "widening the lens" to consider data from longer times frames. Today, this bias can be seen when looking at inflation within the current economic environment
Looking back…way back
Over the past two decades, prior to the Covid-19 Pandemic, there really wasn't much need to seek additional sources of diversification within the traditional 60% equities and 40% bonds (60/40) portfolio. A 60/40 portfolio historically worked well in delivering attractive risk-adjusted returns ¹. Bonds buffered the portfolio if equities didn't perform well due to a very important phenomenon – a strong negative correlation between equities and bonds (the increase in value of one is associated with the decrease in value of the other) ².
While this worked well for nearly two decades, does this mean it will continue over the next two decades or should we consider if we have been taking this negative correlation for granted? History tells us that this negative correlation holds if inflation remains under 2%³. But perhaps the question investors should be asking is how often does inflation average above 2%?
The surprising answer is most of the time - depending on how far back you look.
Historically speaking, up until 2020, the prior two decades were an anomaly. Over the last 100 years we have spent most of the time in environments where inflation was above 2%, and where bonds and equities were positively correlated⁴. In fact, we've spent roughly 60 of the last 100 years, including the last four, just such an environment.
The "new" need for added portfolio diversification
As we spend more time in an environment that resembles the historical "norm", there is an increased focus on the need for additional diversification. While we feel stocks and bonds remain the bedrock of a diversified portfolio, commodities are interesting for their low to negative correlation with both bonds and equities over the last 50 years, and more importantly over the last five years⁵. Because of this negative correlation, adding commodities to a portfolio can potentially result in better risk adjusted returns.
As we look ahead, there are other dynamics at play that need to be considered. The volatility of inflation is clearly higher in the current era than it was in the prior two decades. We live in a world of elevated geopolitical risk and uncertainty which has been driving countries to become more economically independent through near shoring/friend shoring/reshoring. This trend is inflationary as the world builds parallel supply chains and loses economies of scale. Against this backdrop, concerns of low growth are coming to the forefront as the increasing uncertainty rising from the unpredictability of U.S policy could result in a contraction of business activity. For the first time in several decades there is a real possibility of an economy with stagflation (a combination of high inflation, stagnant economic growth, and elevated unemployment).
Portfolio considerations with stagflation in mind
Asset classes perform differently during different economic periods. As seen in the charts below, using different combinations of high/low economic growth and high/low inflation helps illustrate the different returns for equities, bonds and commodities during different macro-economic environments.
Asset Class Returns in Different Macro Environments
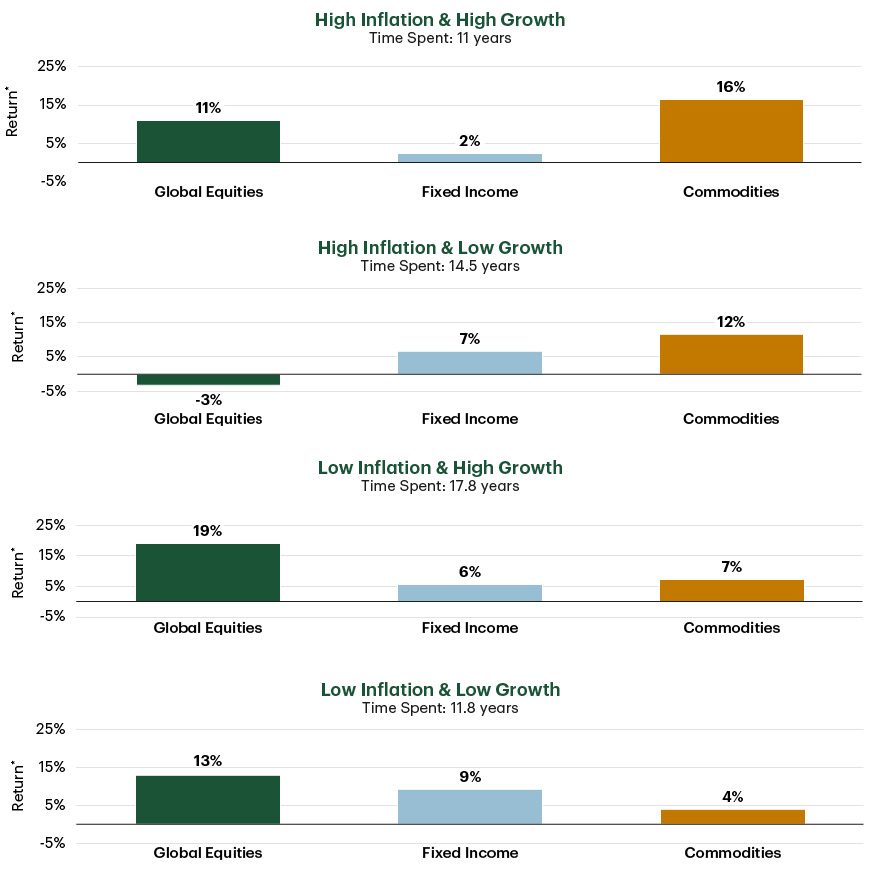
1 3-month return, annualized. Note: For illustrative purposes only. Data from January 1970 to December 2024. High Growth = Monthly GDP greater than trailing 5-year GDP average. Low Growth = Monthly GDP lower than trailing 5-year GDP average. High Inflation = Trailing 3-month average CPI greater than trailing 3-year average CPI. Low Inflation = Trailing 3-month average CPI less than trailing 3-year average CPI. Global Equities = NDDUWI Index. Fixed Income = LUATTRUU Index. Commodities= BCOMTR Index. Source: Bloomberg Finance L.P. As of Dec 31, 2024.
There is no surprise that commodities perform well in high growth and high inflation environments. What may surprise some is that commodities tend to be the best performing asset in the stagflation quadrant, when growth is low, but inflation is high. What's also important to note is that although fixed Income appears to have provided reasonable returns during periods of stagflation, these previous periods were when nominal yields were over 10% during a period in the 1980s. Considering the starting point of yields today, it would be highly unlikely that fixed income would be able to return 7% if the economy fell into a period of stagflation.
Mitigating equity pullbacks
The diversifying benefits of commodities also include helping to mitigate equity pullbacks. As seen in the chart below, over the last 50 years, roughly 2/3rds of the time a portfolio with a 10% allocation to commodities had a lower pullback versus a portfolio without. It is also worth highlighting that the 1/3rd of the time in which commodities didn't help was predominantly in the decade prior to the Covid-19 Pandemic. A decade in which commodities were in a bear cycle and an era characterized by low growth, low interest rates, and low inflation. This is unlikely in the decade ahead as it looks like we are in the early innings of a commodity supercycle.
Including Commodities Can Help Lower Max Drawdowns
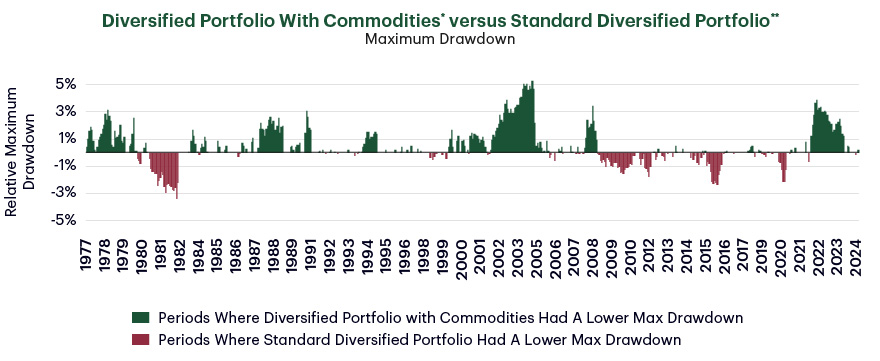
1 Monthly Data from 1977 to 2024. 2 Diversified Portfolio With Commodities: 54% MSCI USA Index, 36% Bloomberg U.S. Aggregate Bond Index, 10% BCOM Total Return Index. 3 Standard Diversified Portfolio: 60% MSCI USA Index, 40% Bloomberg U.S. Aggregate Bond Index. Source: TD Asset Management Inc., Bloomberg Finance L.P. As of December 31, 2024.
As the world seemingly becomes more disorderly economically, it is less certain what it will look like over the next few years. In an uncertain investing environment, a more diversified portfolio that is less vulnerable to inflation is key to help ensure investors stay on track to reach their goals. Commodities may be a key ingredient in building such a portfolio.
¹ Source: Measures an investment's return after considering the degree of risk taken to achieve it.
² Source: SBBI via CFA Institute. As of May 31, 2024.
³ Source: Bloomberg Finance L.P., TD Asset Management Inc. Data as of Sep.30, 2024.
⁴ Source: Bloomberg Finance L.P., CPI Year-over-year Index. Data as of Dec. 31, 2024.
⁵ Source: Bloomberg Finance L.P. Data as of April 30, 2024.
The information contained herein has been provided by TD Asset Management Inc. and is for information purposes only. The information has been drawn from sources believed to be reliable. The information does not provide financial, legal, tax or investment advice. Particular investment, tax, or trading strategies should be evaluated relative to each individual’s objectives and risk tolerance. Graphs and charts are used for illustrative purposes only and do not reflect future values or future performance of any investment.
Certain statements in this document may contain forward-looking statements (“FLS”) that are predictive in nature and may include words such as “expects”, “anticipates”, “intends”, “believes”, “estimates” and similar forward-looking expressions or negative versions thereof. FLS are based on current expectations and projections about future general economic, political and relevant market factors, such as interest and foreign exchange rates, equity and capital markets, the general business environment, assuming no changes to tax or other laws or government regulation or catastrophic events. Expectations and projections about future events are inherently subject to risks and uncertainties, which may be unforeseeable. Such expectations and projections may be incorrect in the future. FLS are not guarantees of future performance. Actual events could differ materially from those expressed or implied in any FLS. A number of important factors including those factors set out above can contribute to these digressions. You should avoid placing any reliance on FLS.
Index returns are shown for comparative purposes only. Indexes are unmanaged and their returns include reinvestment of dividends, if applicable, but do not include any sales charges or fees as such costs would lower performance. It is not possible to invest directly in an index.
Bloomberg and Bloomberg.com are trademarks and service marks of Bloomberg Finance L.P., a Delaware limited partnership, or its subsidiaries. All rights reserved.
TD Asset Management Inc. is a wholly-owned subsidiary of The Toronto-Dominion Bank.
®The TD logo and other TD trademarks are the property of The Toronto-Dominion Bank or its subsidiaries.
TDAM Connections at a Glance:
You might also be interested in:

TDAM Talks Podcast

A Look Into Our Best Thinking

Explore our Insights