Investor Knowledge
June 06 2025
The TD Greystone Balanced Plus Fund: 10 Years of Client-Focused Evolution
10 min read

Ten years ago, TD Asset Management Inc. ("TDAM") set out to create our most innovative, client-focused balanced fund. Our approach combined three decades of asset allocation experience with the goal of improving investment outcomes for our clients. We included a large weight to private alternative assets to improve the risk adjusted returns and help clients meet their objectives. The result of our efforts was the TD Greystone Balanced Plus Fund (the "Fund"), which launched on March 31, 2015. For over 10 years, the Fund has provided our clients access to – what we consider – one of TDAM's best investment ideas for a multi-asset mix fund and includes equities, fixed income, and private alternatives in a single solution.
For some clients, it can be a challenging undertaking to manage the cash flows and liquidity needs associated with private alternative assets. Offering the exposure packaged in an institutional pooled fund solution can provide access to alternatives with administrative ease in a cost-efficient manner. Having a substantial allocation to alternatives can also provide exposure to asset classes that may help reduce volatility without reducing the expected returns of the overall portfolio and lead to more the resilient asset mixes.
Our process is not static (i.e. setting the asset mix and forgetting it). Markets are dynamic and asset mixes must evolve to continue to meet clients' needs. The strategic asset allocation is reviewed, and as new asset exposures become available that provide diversification or inflation hedging characteristics, they can be added to the mix after careful due diligence. Having a deep tool kit with a full spectrum of solutions across equities, fixed income, alternatives, and commodities, enables us to provide more resilient exposures in the portfolio that may increase return and improve risk adjusted returns. Our process also includes tactical asset allocation and daily rebalancing, which can further tilt the portfolio dynamically as market conditions change in order to potentially increase returns or reduce risk and protect capital.
Figure 1: Evolving to Help Meet Client Needs
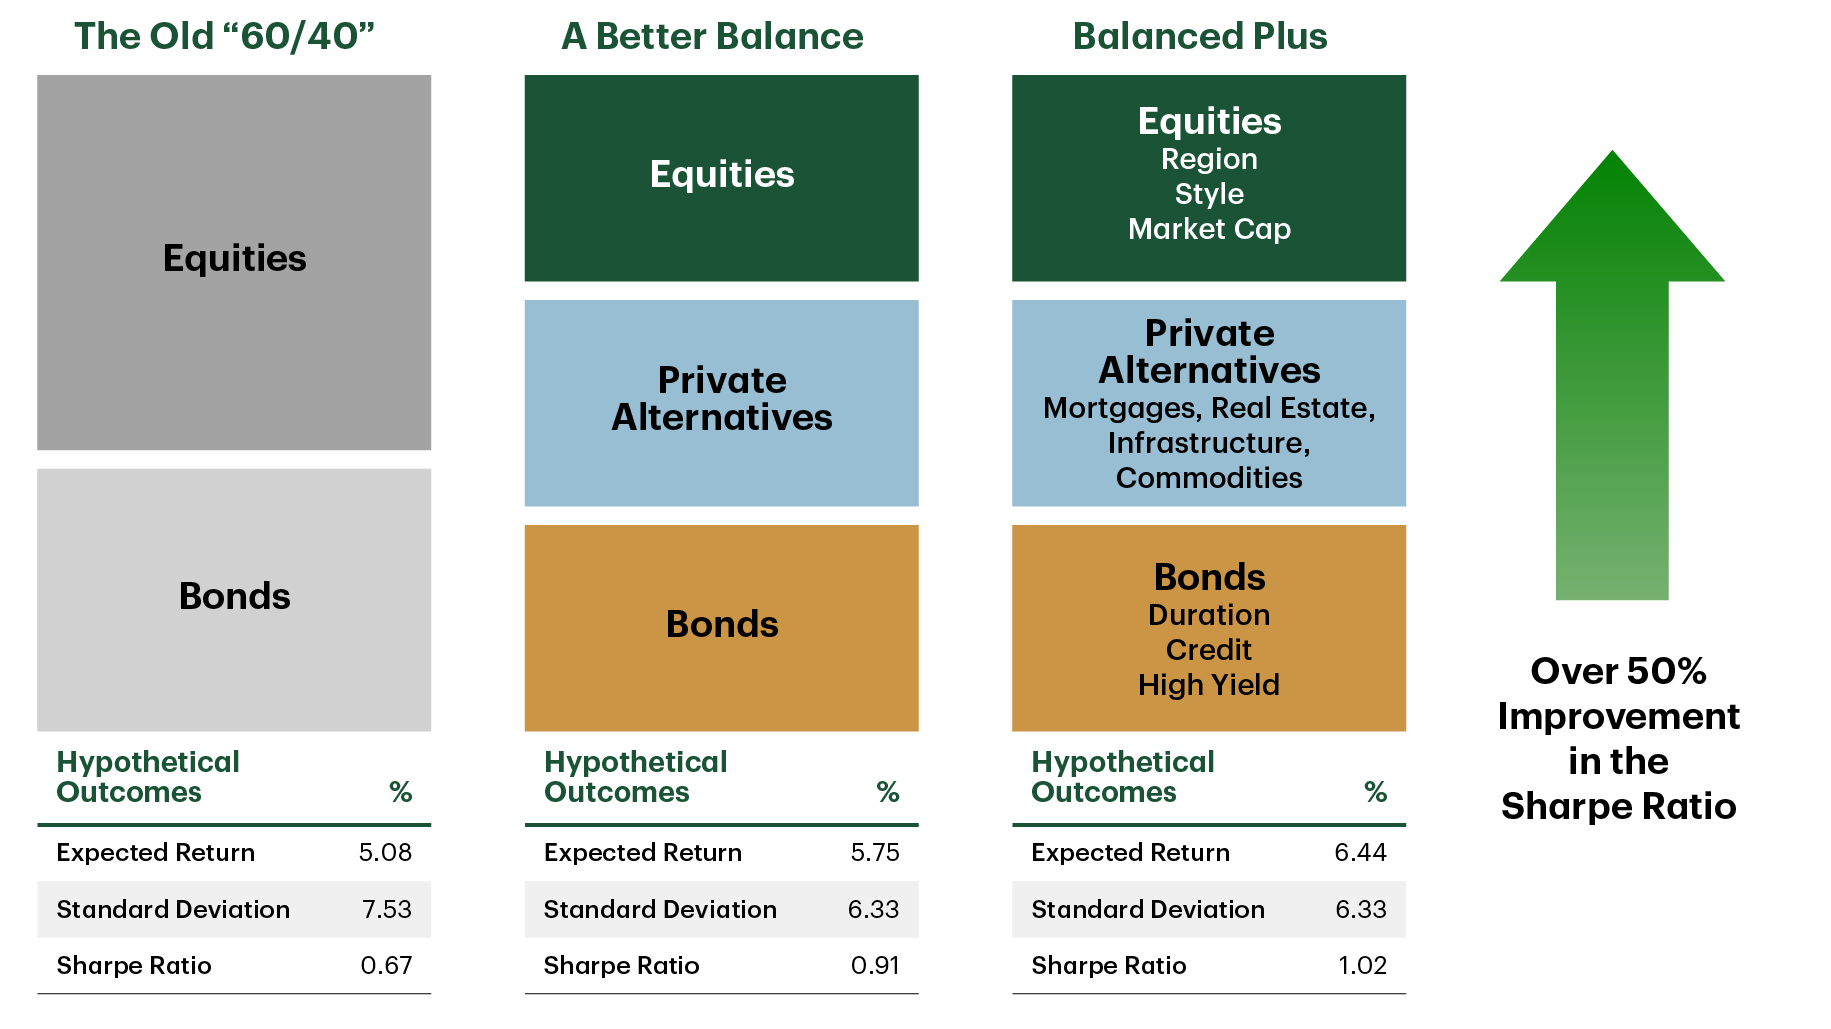
Expected returns and standard deviation are derived using TDAM’s long-term asset class assumption methodology. Copy of the methodology is available upon request. Note: For illustrative purposes only. Source: TD Asset Management Inc.
For more information on our Long Term Capital Market Return methodology, see our TD Asset Management Long-Term Asset Class Assumptions paper.
Inclusion of Alternatives May Improve Risk Adjusted Returns and Help Mitigate Sequence of Return Risk
Certain institutional investors, such as endowments and foundations, non-profits, or aboriginal groups, may be subject to sequence of return risk. That risk relates to the timing of cash outflows and market events that may permanently impair the capital base. Having exposure to private alternatives may help reduce that risk by focusing on a diversified portfolio with a high Sharpe Ratio and truncating the left tail of the return distribution. For further details on sequence of return risk, see our Managing Sequence of Return Risk for Foundations and Endowments paper.
As demonstrated in Figure 2a and Figure 2b, TDAM has a track record of delivering a strong Sharpe Ratio and strong maximum drawdown characteristics, which can help mitigate sequence of return risk.
Figure 2a: Strong Risk Adjusted Returns (Relative Sharpe Ratio vs. Custom Universe1)
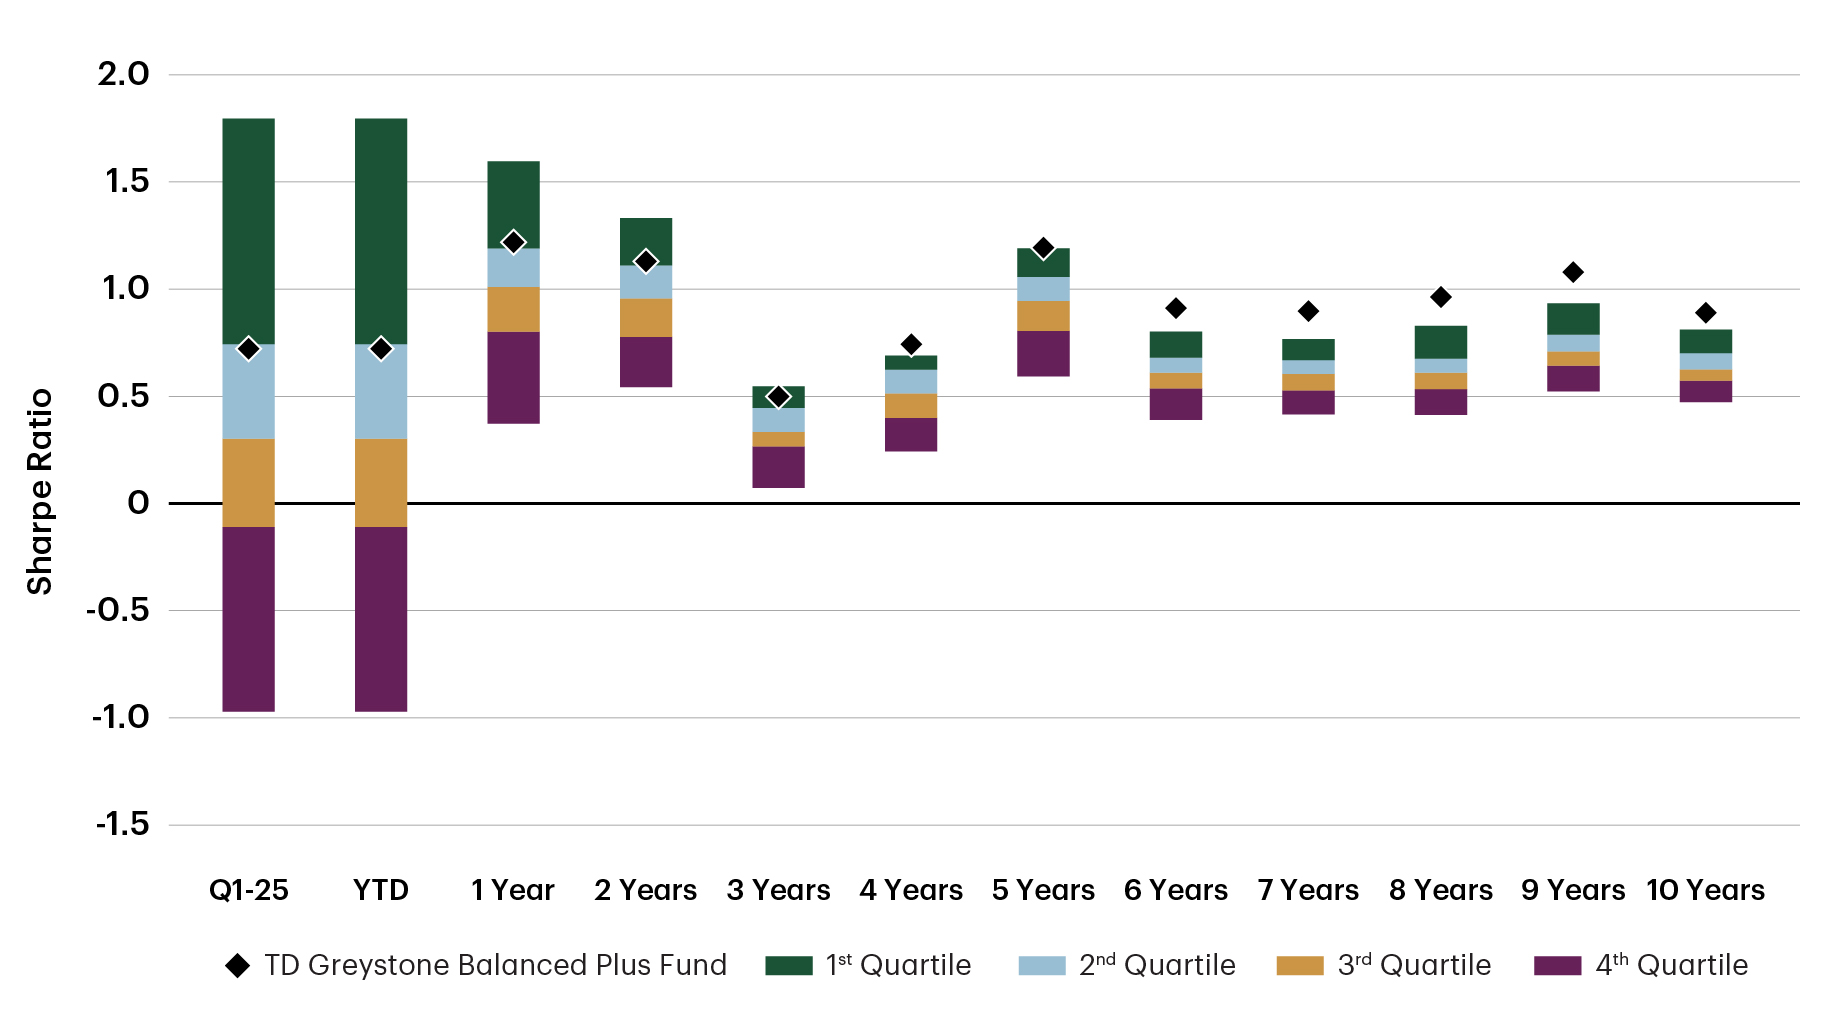
1Custom balanced peer group is the combination of eVestment’s Canadian Balanced peer group and C$ denominated Funds within the Global Balanced peer group. eVestment Alliance, LLC - Fund Category: Global Balanced. Current number of funds in the category: 71-83. Inception is Apr 1, 2015 (10.00 years).
Note: Quartile rankings are intended to measure how well a fund has performed compared to other funds in its peer group. Quartile rankings are compiled by ranking all of the funds in a category by return over a given time period. The top performing 25% of funds in the category are assigned a quartile ranking of 1, the next 25% a 2, the next 25% a 3, and the bottom 25% of funds a 4. Quartile rankings can change over time.
Source: eVestment Alliance, LLC. As of Mar 31, 2025. Data pulled April 22, 2025.
Figure 2b: Maximum Drawdown
(Typically Preserving Capital in Market Downturns Relative to Custom Peer Group1)
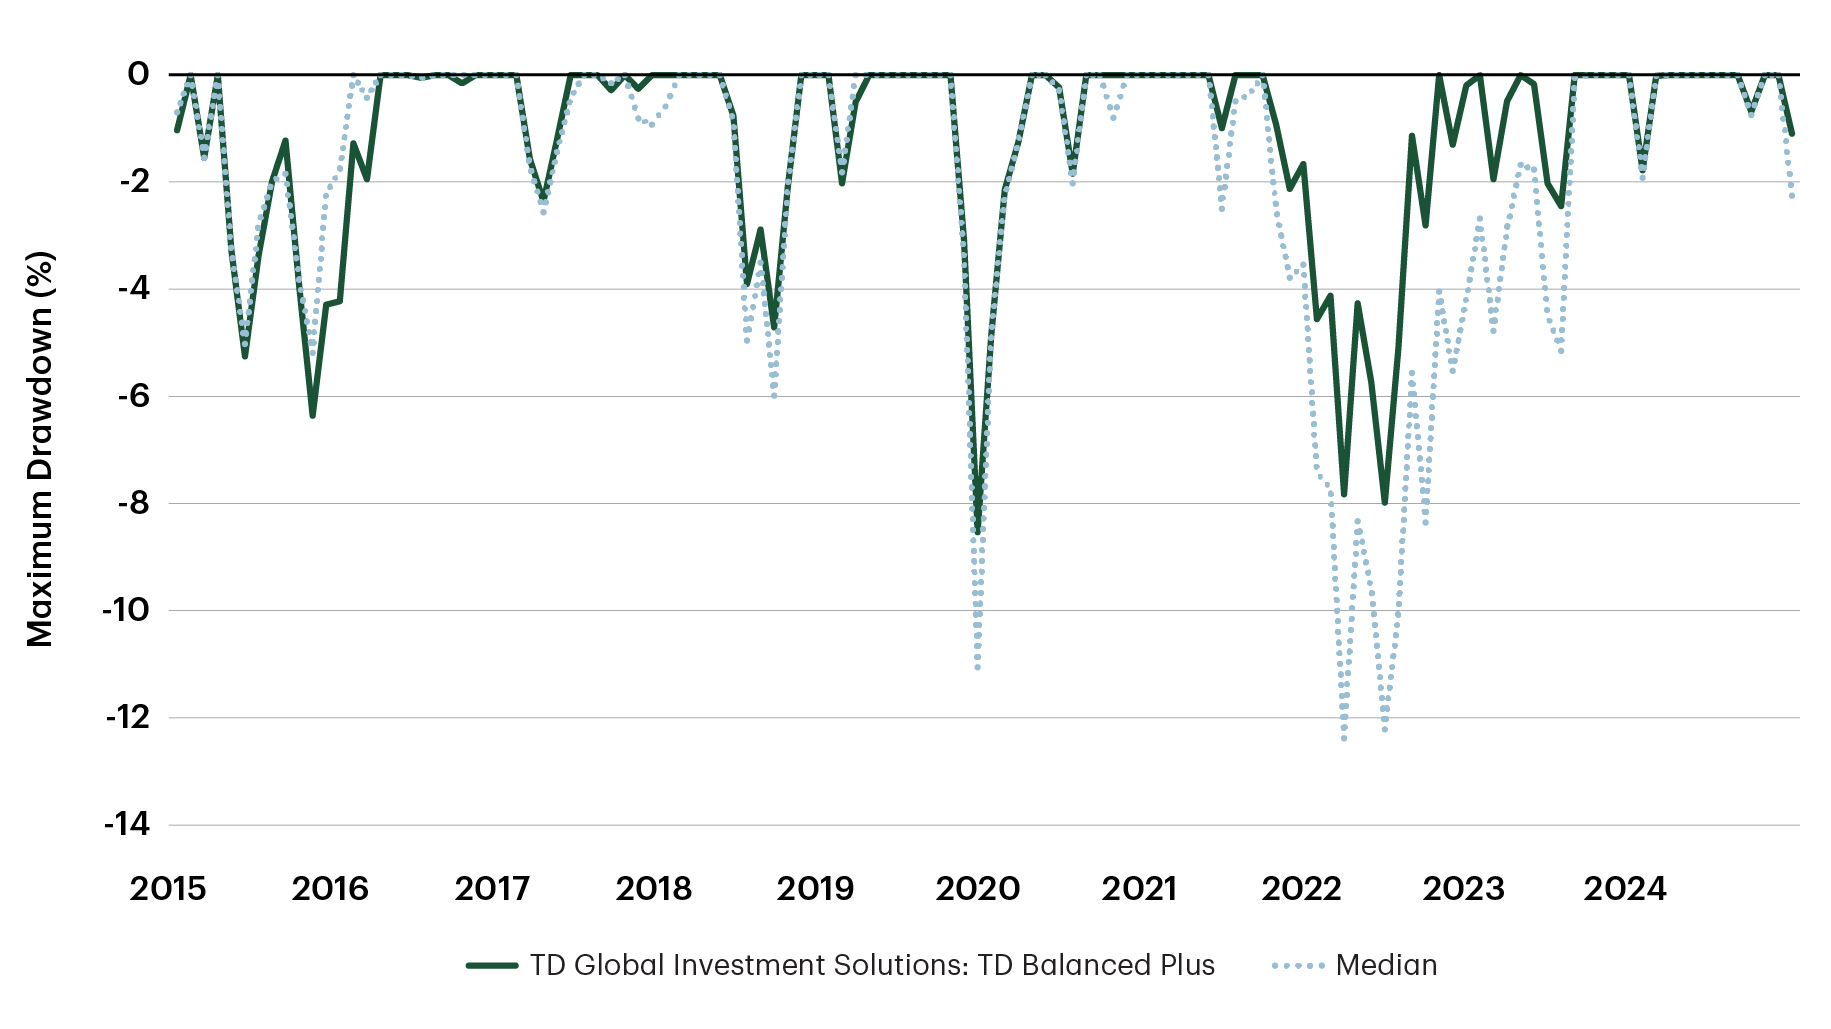
1 Custom balanced peer group is the combination of eVestment’s Canadian Balanced peer group and C$ denominated Funds within the Global Balanced peer group. eVestment Alliance, LLC - Fund Category: Global Balanced. Current number of funds in the category: 71-83. Inception is Apr 1, 2015 (10.00 years).
Note: The Median manager is taking the top performing 50% of funds in the category.
Source: eVestment Alliance, LLC. As of Mar 31, 2025. Data pulled Apr 14, 2025.
At TDAM, our team strives to assist clients with 1) asset mix reviews by examining the probability that a given asset mix will meet their objectives, 2) examining the sensitivity of the client's cash flows, 3) helping to reduce sequence of return risk, and 4) managing considerations such as the disbursement quota. We encourage our clients to have an open dialogue about known cash flows so that we might be able to help lessen the general timing impact on the overall portfolio. We want to collaborate with our clients and our goal is to assist them in meeting their objectives as they evolve.
Figure 3 helps illustrate the long-term impact on the account value through the Fund versus a balanced peer group that has limited alternative investment options. By integrating alternative investments, managing volatility, increasing the Sharpe Ratio, and mitigating sequence of return risk, the Fund's track record demonstrates a material enhancement in the overall capital base for endowment and foundation clients with a regular withdrawal. A $100 million dollar client invested in the Fund and withdrawing 5% would currently have more capital versus other balanced funds.
Figure 3: Growth in Account Value
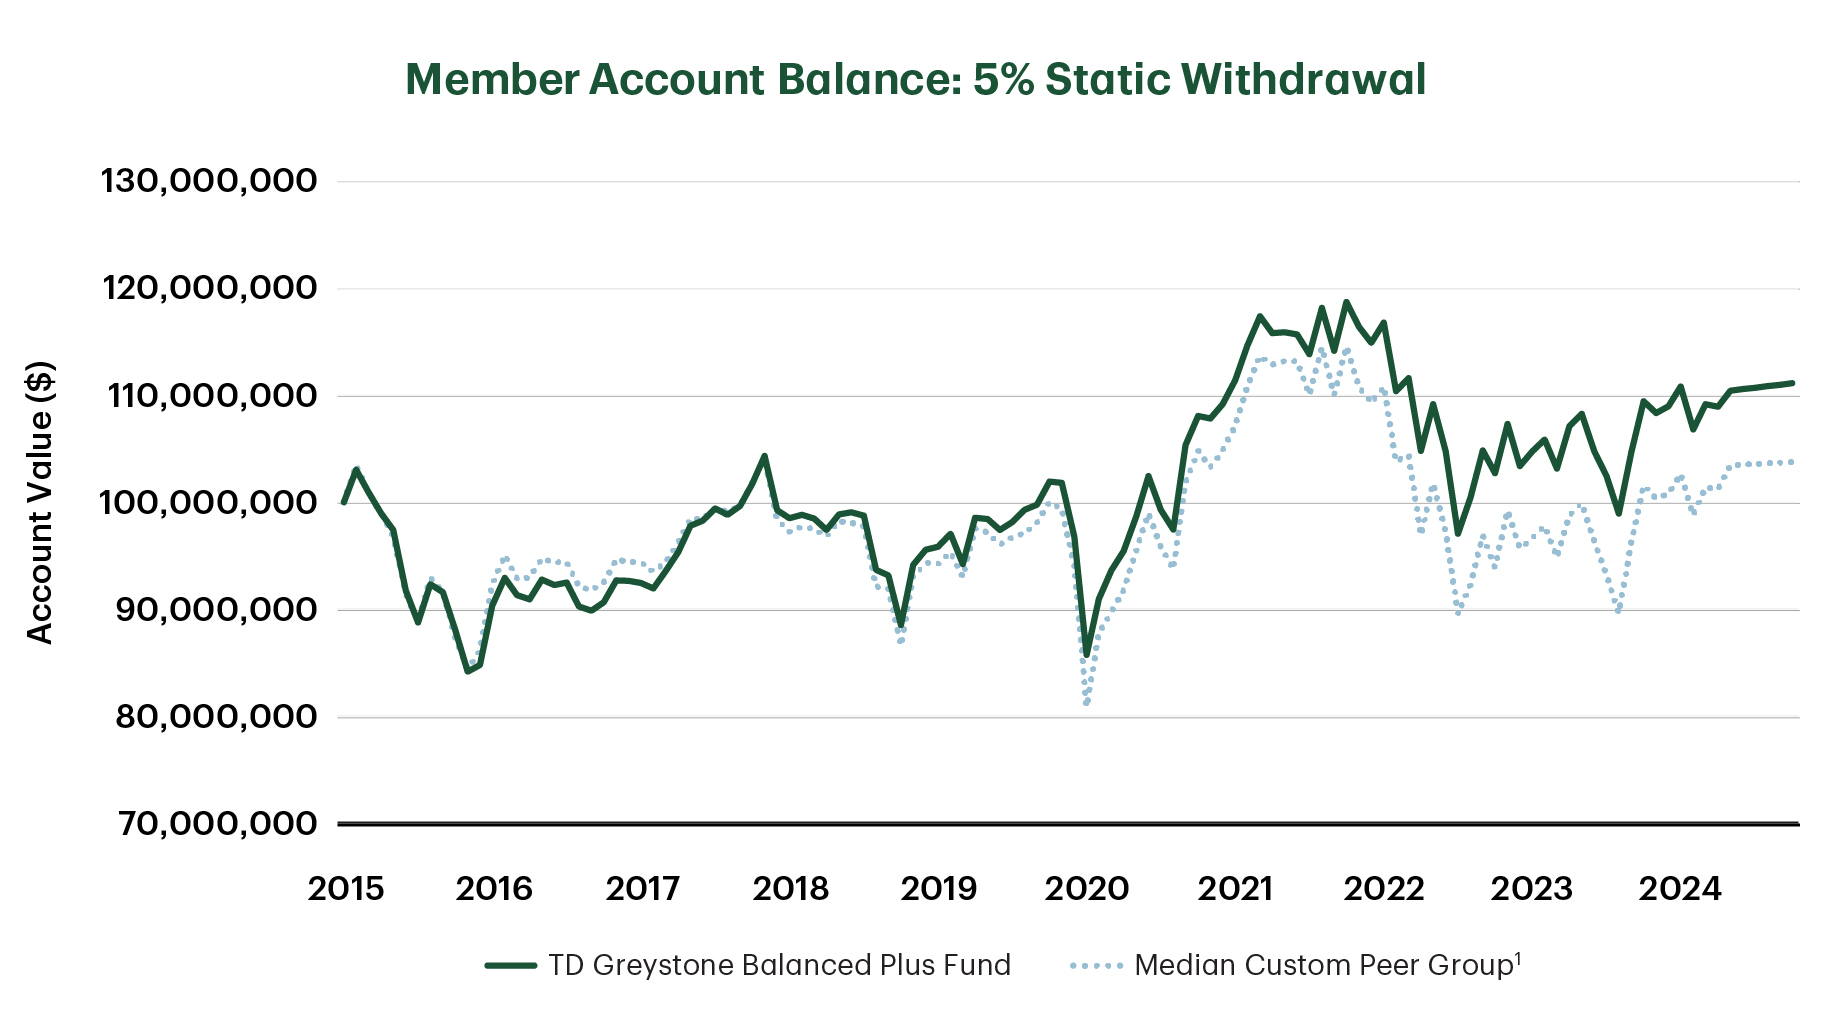
1 Custom balanced peer group is the combination of eVestment’s Canadian Balanced peer group and C$ denominated Funds within the Global Balanced peer group. eVestment Alliance, LLC - Fund Category: Global Balanced. Current number of funds in the category: 71-83. Inception is Apr 1, 2015 (9.75 years).
Note: The Median manager s taking the top performing 50% of funds in the category. Client account balance in C$ with static 5% withdrawal relative to median manager.
Source: eVestment Alliance, LLC, TD Asset Management. As of Dec 31, 2024.
10 Years of Delivering for our Clients
We believe our approach provides an excellent combination of asset allocation and portfolio management for our clients, which is demonstrated in our strong track record of delivering risk adjusted returns.
Figure 4a: TD Greystone Balanced Plus Fund vs. Benchmark
Returns as of Mar 31, 2025 |
3 mths |
YTD |
1 yr |
2 yrs |
3 yrs |
4 yrs |
5 yrs |
10 yrs |
Since Mar 31-15 |
|---|---|---|---|---|---|---|---|---|---|
TD Greystone Balanced Plus Fund |
1.95% | 1.95% |
9.92% |
10.39% |
7.48% |
7.80% |
10.24% |
7.35% |
7.35% |
Benchmark* |
1.17% |
1.17% |
10.54% |
11.04% |
7.65% |
7.47% |
9.56% |
6.94% |
6.94% |
Difference |
0.78% |
0.78% |
-0.62% |
-0.64% |
-0.17% |
0.33% |
0.68% |
0.41% |
0.41% |
Returns as of Dec 31, |
2024 |
2023 |
2022 |
2021 |
2020 |
2019 |
2018 |
2017 |
2016 |
TD Greystone Balanced Plus Fund
|
13.33% |
8.74% |
-2.83% |
13.79% |
9.55% |
15.05% |
-0.28% |
10.42% |
4.90% |
Benchmark* |
14.52% |
11.34% |
-5.90% |
11.54% |
9.46% |
13.68% |
0.58% |
8.26% |
6.83% |
Difference |
-1.19% |
-2.60% | 3.07% |
2.25% |
0.09% |
1.38% |
-0.86% |
2.16% |
-1.92% |
1 Current benchmark is FTSE Canada 91 Day T-Bill 1%, FTSE Canada Universe 21%, Custom Mortgage Index 8%, S&P/TSX Composite 15%, S&P 500 11%, MSCI EAFE (Net) 9%, MSCI World (Net) 10%, MSCI World Small Cap Index 2%, MSCI Emerging Markets Index 2%, Bloomberg Commodity Index Canadian Dollar Hedged Daily Total Return 1%, MSCI/REALpac Canada Annual Property Index - All Assets 10%, 10% US Core CPI plus 5% over a rolling 4-year period. Due to the delay in the availability of U.S. Core Consumer Price Index (CPI) data at month end, the U.S. Core Consumer Price Index return is lagged by one month.
Note: Net of expenses. Numbers may not add due to rounding. Includes cash.
Source: TD Asset Management Inc. As of Mar 31, 2025.
Figure 4b: Balanced Plus Fund Returns
(Relative Performance vs. Custom Peer Group1)
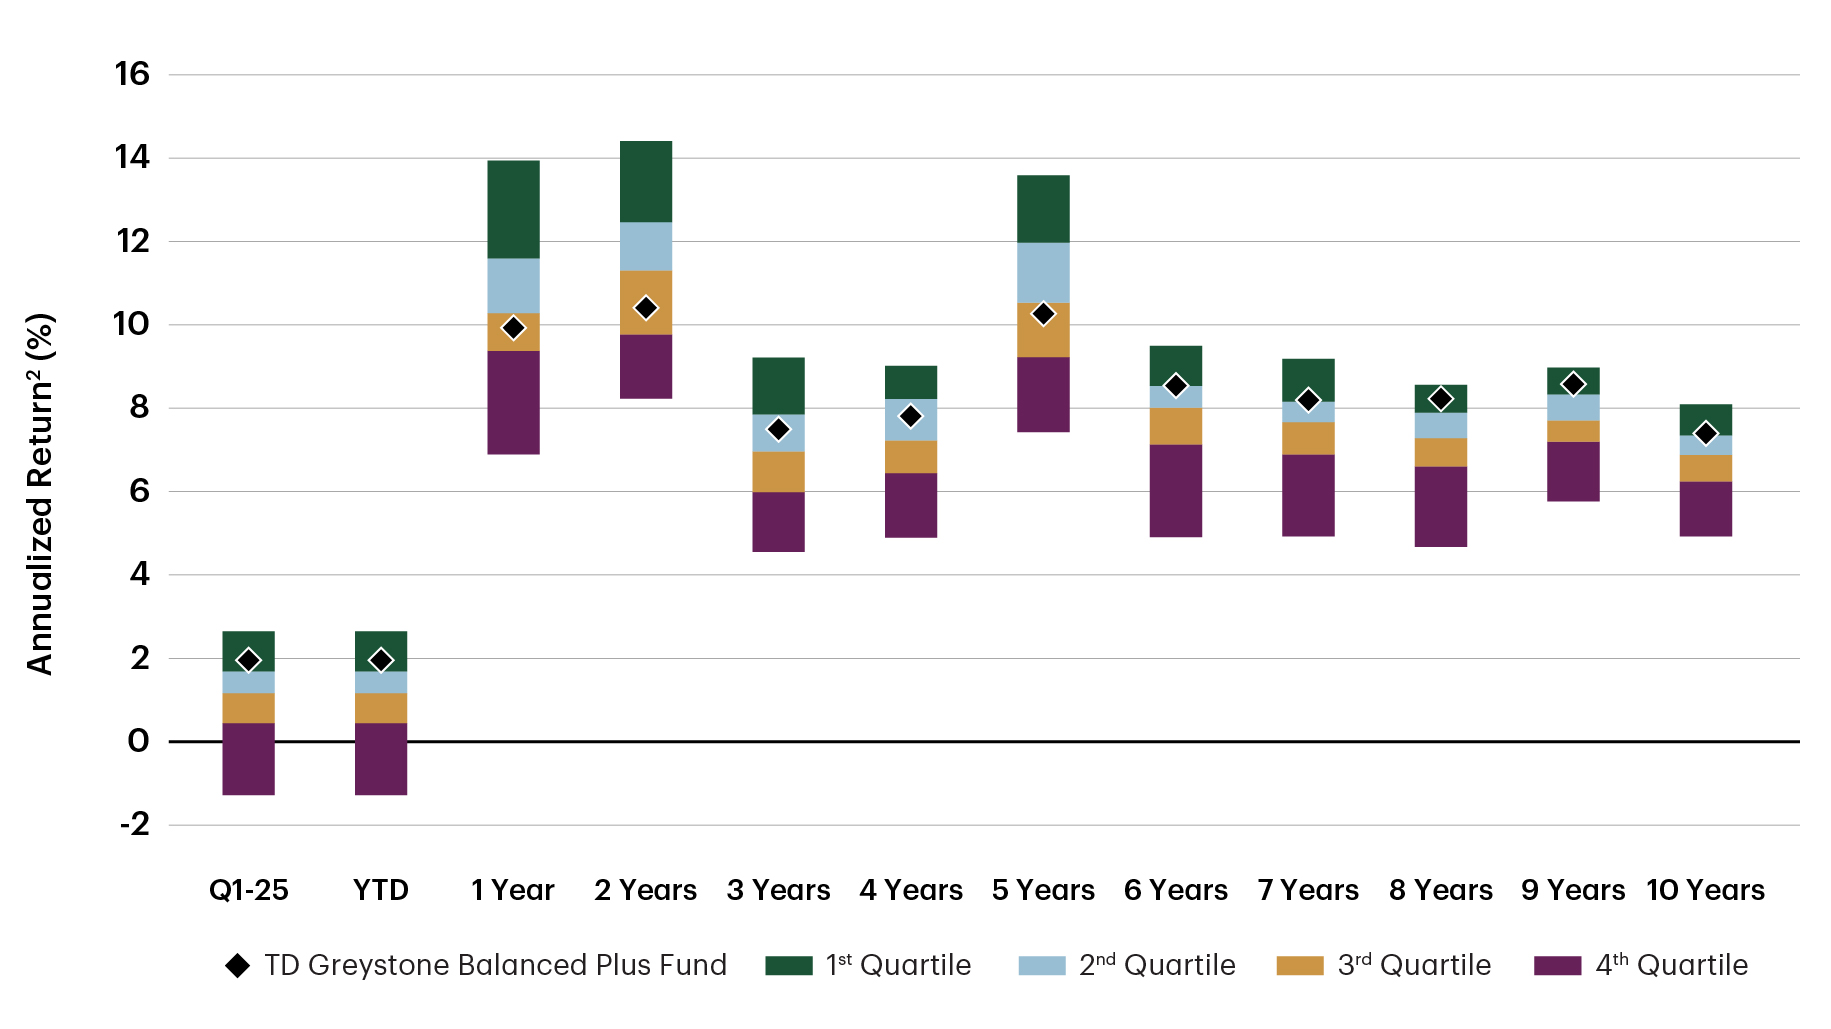
1 Custom balanced peer group is the combination of eVestment’s Canadian Balanced peer group and C$ denominated Funds within the Global Balanced peer group. 2 Returns for periods over one year are annualized. eVestment Alliance, LLC - Fund Category: Global Balanced. Current number of funds in the category: 71-83. Inception is Apr 1, 2015 (10.00 years).
Note: Quartile rankings are intended to measure how well a fund has performed compared to other funds in its peer group. Quartile rankings are compiled by ranking all of the funds in a category by return over a given time period. The top performing 25% of funds in the category are assigned a quartile ranking of 1, the next 25% a 2, the next 25% a 3, and the bottom 25% of funds a 4. Quartile rankings can change over time.
Source: eVestment Alliance, LLC. As of Mar 31, 2025. Data pulled Apr 22, 2025.
Figure 4c: Balanced Plus Fund Risk
Relative Standard Deviation vs Custom Peer Group1)
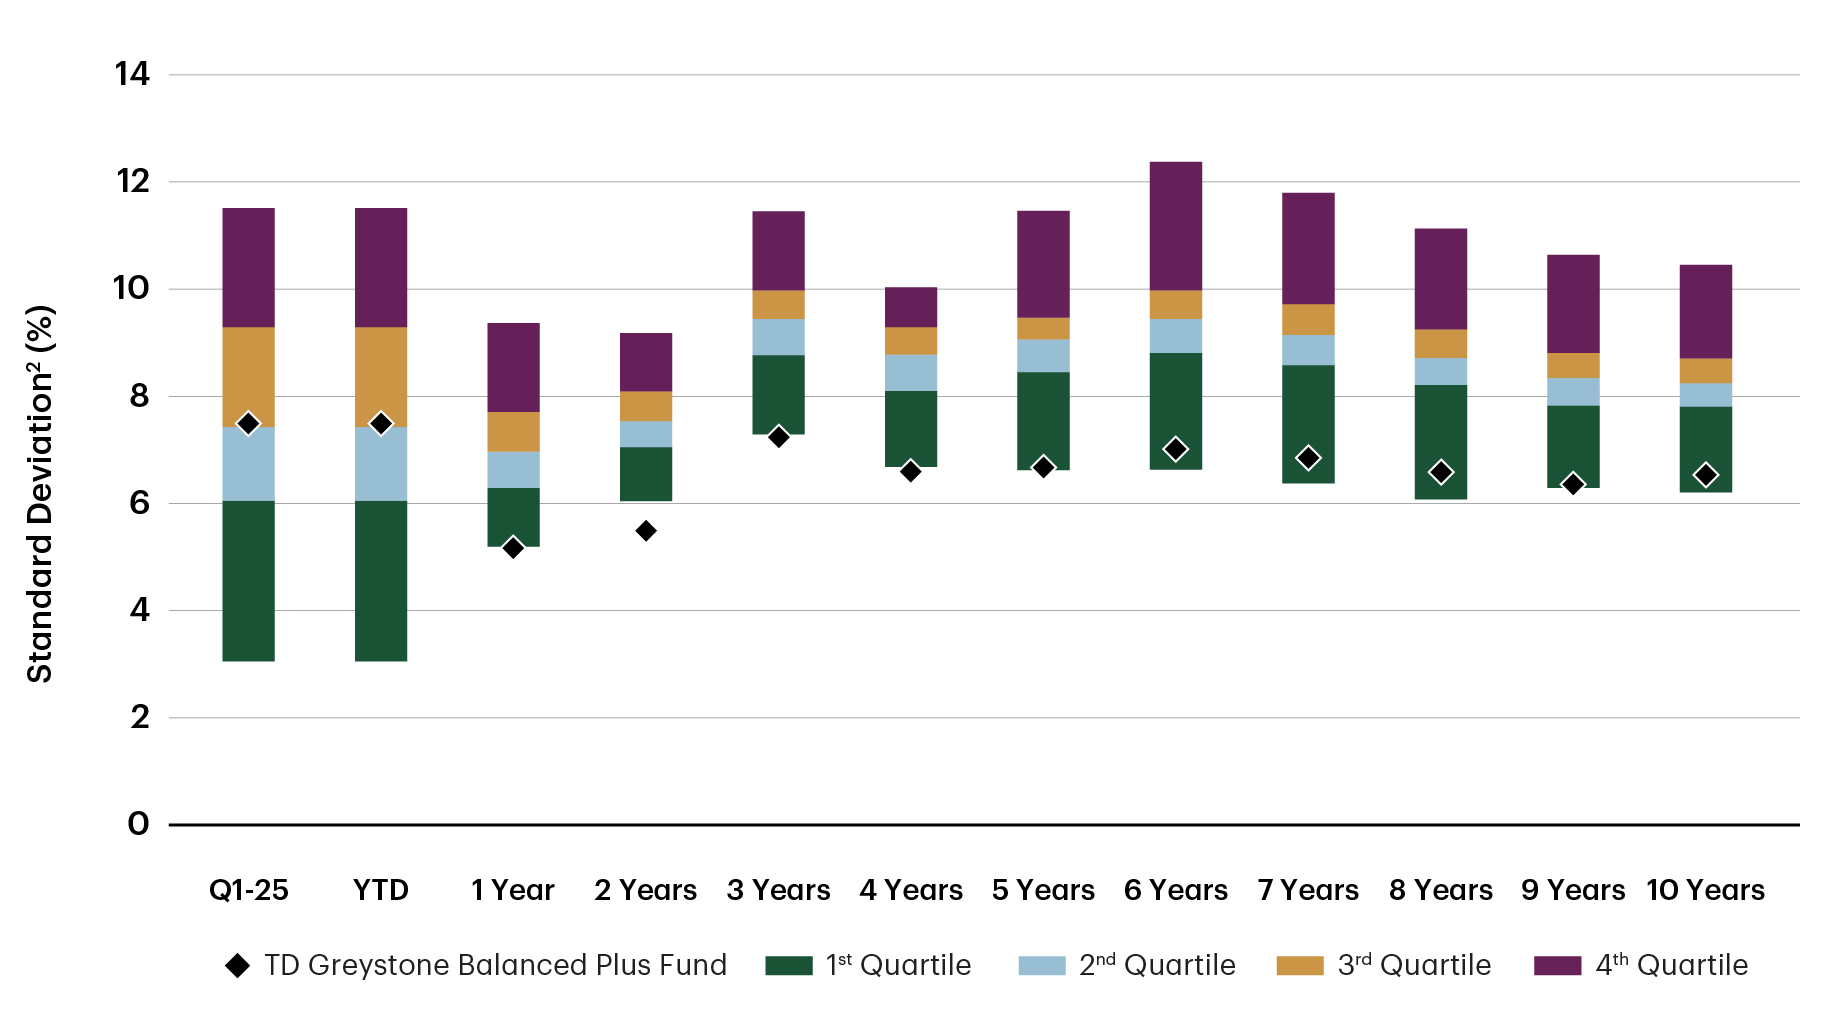
1 Custom balanced peer group is the combination of eVestment’s Canadian Balanced peer group and C$ denominated Funds within the Global Balanced peer group. 2 Standard Deviations for periods over one year are annualized. eVestment Alliance, LLC - Fund Category: Global Balanced. Current number of funds in the category: 71-83. Inception is Apr 1, 2015 (10.00 years).
Note: Quartile rankings are intended to measure how well a fund has performed compared to other funds in its peer group. Quartile rankings are compiled by ranking all of the funds in a category by return over a given time period. The top performing 25% of funds in the category are assigned a quartile ranking of 1, the next 25% a 2, the next 25% a 3, and the bottom 25% of funds a 4. Quartile rankings can change over time.
Source: eVestment Alliance, LLC. As of Mar 31, 2025. Data pulled Apr 22, 2025.
In our view, the TD Greystone Balanced Plus Fund is one of TDAM's best investment ideas for a multi-asset mix solution. Drawing upon over three decades of experience providing multi-asset strategies across fixed income, equities, alternatives, and commodities, we strive to continually evolve to improve clients' investment outcomes and offer a variety of multi-asset solutions that can help clients meet their specific objectives.
For more information on the TD Greystone Balanced Plus Fund or TDAM's other multi-asset strategies, please contact your relationship manager.
For Canadian institutional investment professionals only. Not for further distribution.
The information contained herein is for information purposes only. The information has been drawn from sources believed to be reliable. Graphs and charts are used for illustrative purposes only and do not reflect future values or future performance of any investment. The information does not provide financial, legal, tax or investment advice. Particular investment, tax or trading strategies should be evaluated relative to each individual’s objectives and risk tolerance.
This material is not an offer to any person in any jurisdiction where unlawful or unauthorized. These materials have not been reviewed by and are not registered with any securities or other regulatory authority in jurisdictions where we operate.
Any general discussion or opinions contained within these materials regarding securities or market conditions represent our view or the view of the source cited. Unless otherwise indicated, such view is as of the date noted and is subject to change.
Past Performance: Any performance information referenced represents past performance and is not indicative of future returns. There is no guarantee that the investment objectives will be achieved.
No investment strategy or risk management technique can guarantee returns or eliminate risk in any market environment. Any characteristics, guidelines, constraints or other information provided for this material is representative of the investment strategy and is provided for illustrative purposes only. They may change at any time and may differ for a specific account. Each client account is individually managed; actual holdings will vary for each client and there is no guarantee that a particular client's account will have the same characteristics as described herein. Any information about the holdings, asset allocation, or sector diversification is historical and is not an indication of future performance or any future portfolio composition, which will vary. Portfolio holdings are representative of the strategy, are subject to change at any time and are not a recommendation to buy or sell a security. The securities identified and described do not represent all of the securities purchased, sold or recommended for the portfolio. It should not be assumed that an investment in these securities or sectors was or will be profitable.
All products contain risk. Important information about the pooled fund is contained in their offering circular, which we encourage you to read before investing. Please obtain a copy. The indicated rates of return are the historical annual compounded total returns of the funds including changes in unit value and reinvestment of all distributions. Yields, investment returns and unit values will fluctuate for all funds. All performance data represent past returns and are not necessarily indicative of future performance. Pooled Fund units are not deposits as defined by the Canada Deposit Insurance Corporation or any other government deposit insurer and are not guaranteed by The Toronto-Dominion Bank. Investment strategies and current holdings are subject to change. TD Pooled Funds are managed by TD Asset Management Inc.
Sharpe Measure is a ratio of returns generated by the fund, over and above the risk-free rate of return and the total risk associated with it and can change monthly. A high and positive ratio shows superior performance and a low and negative ratio is an indication of unfavourable performance. Standard deviation is a statistical measure of the range of a fund’s performance. When a fund has a high standard deviation, its range of performance has been very wide, indicating that there is a greater potential for volatility than those with low standard deviations.
This document may contain forward-looking statements (“FLS”). FLS reflect current expectations and projections about future events and/or outcomes based on data currently available. Such expectations and projections may be incorrect in the future as events which were not anticipated or considered in their formulation may occur and lead to results that differ materially from those expressed or implied. FLS are not guarantees of future performance and reliance on FLS should be avoided.
Any indices cited are widely accepted benchmarks for investment and represent non-managed investment portfolios. It is not possible to invest directly in an index. Information about the indices allows for the comparisons of an investment strategy’s results to that of a widely recognized market index. There is no representation that such index is an appropriate benchmark for such comparison. Results for an index do not reflect trading commissions and costs. Index volatility may be materially different from a strategy’s volatility and portfolio holdings may differ significantly from the securities comprising the index.
TD Global Investment Solutions represents TD Asset Management Inc. (“TDAM”) and Epoch Investment Partners, Inc. (“TD Epoch”). TDAM and TD Epoch are affiliates and wholly-owned subsidiaries of The Toronto-Dominion Bank. ® The TD logo and other TD trademarks are the property of The Toronto-Dominion Bank or its subsidiaries.
Related content
July 08 2026
-
5 minutes
April 27 2026
-
5 minutes
More by this Author
March 29 2023
-
10 min read
April 13 2023
-
10 min read