
@TDAM_Canada
Investor Knowledge + 10 Minutes = Current Insights
The U.S. stock market has become more top-heavy than at any point in the last half-century. Today, just 10 stocks make up roughly 36% of the S&P 500’s total weight.[1] On the surface, this concentration has been a tailwind for investors. The strong performance of a few mega-cap names (particularly in technology) has helped lift overall market returns and made it easier for passive investors to gain exposure to broad equity markets through index funds. But beneath that simplicity lies an increasingly fragile structure.
Why Concentration Is a Problem
When a handful of stocks drive most of the gains, markets become more susceptible to company-specific risks. A downturn in just one or two of these dominant names can ripple through the entire S&P 500 index, masking the performance of the other 490 companies and skewing perceptions of overall market health. This dynamic may leave investors exposed to a false sense of diversification, when in reality their portfolios hinge heavily on the fate of a few firms.
This pattern isn’t new. In every decade, certain sectors or companies have risen to dominance, only to eventually lose their footing. In the 1970s and 1980s, the top of the S&P 500 was filled with industrial and energy giants like IBM and ExxonMobil. By the late 1990s, the baton had been passed to technology stocks, culminating in the dot-com bubble. The 2000s saw value stocks and financials rise, only to be undone by the 2008 financial crisis. Now, once again, there is a surge in concentration. This time it's led by the Magnificent 7 (which include Alphabet, Microsoft, Apple, Amazon, NVIDIA, Tesla and Meta Platforms) and the broader tech sector, with the same warning signs flashing.
Figure 1: Top 10 Largest Stocks in the S&P 500
1985 |
1990 |
1999 |
|||
International Business Machines Corporation |
6.1% |
International Business Machines Corp |
2.9% |
Microsoft Corp. |
4.2% |
Exxon Corporation |
2.4% |
General Electric Co. |
2.8% |
General Electric Co. |
3.3% |
GE Aerospace |
2.2% |
Exxon Mobil Corp. |
2.5% |
International Business Machines Corp. |
2.2% |
American Telephone and Telegraph Company |
1.8% |
Altria Group Inc. |
1.9% |
Nokia of America Corp. |
2.0% |
General Motors Corporation |
1.4% |
Royal Dutch Petroleum Co. |
1.8% |
Intel Corp. |
2.0% |
Bristol-Myers Co. |
1.2% |
AT&T Corp. |
1.7% |
Walmart Inc. |
1.9% |
Royal Dutch Petroleum Co. ADR |
1.1% |
Merck & Co Inc. |
1.5% |
Cisco Systems Inc. |
1.8% |
Amoco Corporation |
1.1% |
Bristol-Myers Squibb Co. |
1.4% |
Exxon Mobil Corp. |
1.7% |
E. I. du Pont de Nemours and Company |
1.1% |
Procter & Gamble Co./The |
1.3% |
AT&T Corp. |
1.6% |
BellSouth Corporation |
1.1% |
Coca-Cola Co./The |
1.3% |
Merck & Co Inc. |
1.5% |
2009 |
2019 |
2025 |
|||
Exxon Mobil Corp. |
4.1% |
Microsoft Corp. |
4.3% |
NVIDIA Corp. |
7.3% |
Microsoft Corp. |
2.2% |
Apple Inc. |
3.5% |
Microsoft Corp. |
7.0% |
Johnson & Johnson |
2.0% |
Amazon.com Inc. |
3.3% |
Apple Inc. |
5.8% |
Procter & Gamble Co. |
2.0% |
Meta Platforms Inc. |
2.0% |
Amazon.com Inc. |
3.9% |
AT&T Corp. |
1.7% |
Berkshire Hathaway Inc. |
1.7% |
Meta Platforms Inc. |
3.1% |
International Business Machines Corp. |
1.7% |
JPMorgan Chase & Co. |
1.5% |
Broadcom Inc. |
2.5% |
JP Morgan Chase & Co. |
1.7% |
Johnson & Johnson |
1.4% |
Alphabet Inc. Class A Shares |
2.0% |
Apple Inc. |
1.6% |
Alphabet Inc. Class A Shares |
1.4% |
Berkshire Hathaway Inc. |
1.7% |
Chevron Corp. |
1.6% |
Alphabet Inc. Class C Shares |
1.4% |
Tesla Inc. |
1.7% |
General Electric Co. |
1.6% |
Exxon Mobil Corp. |
1.3% |
Alphabet Inc. Class C Shares |
1.6% |
Source: Bloomberg Finance L.P., Factset, TD Asset Management Inc. (TDAM). As of December 31 for 1985 – 2019. As of June 30 for 2025.
What makes the current environment particularly notable is the severity of the concentration. One way to measure this is through the Herfindahl-Hirschman Index (HHI), which reflects how many stocks meaningfully contribute to index performance. From 2010 to 2016, both U.S. and global indices had effective concentration rates between 25–30% (see figure 2). Today, global markets have become more diversified, but the S&P 500 has gone in the opposite direction. Its effective contributor count has dropped to just under 10%, a 15-year low (see figure 2), illustrating how dependent the index has become on a small group of stocks.
Figure 2: Percentage of Effective Members of the Index
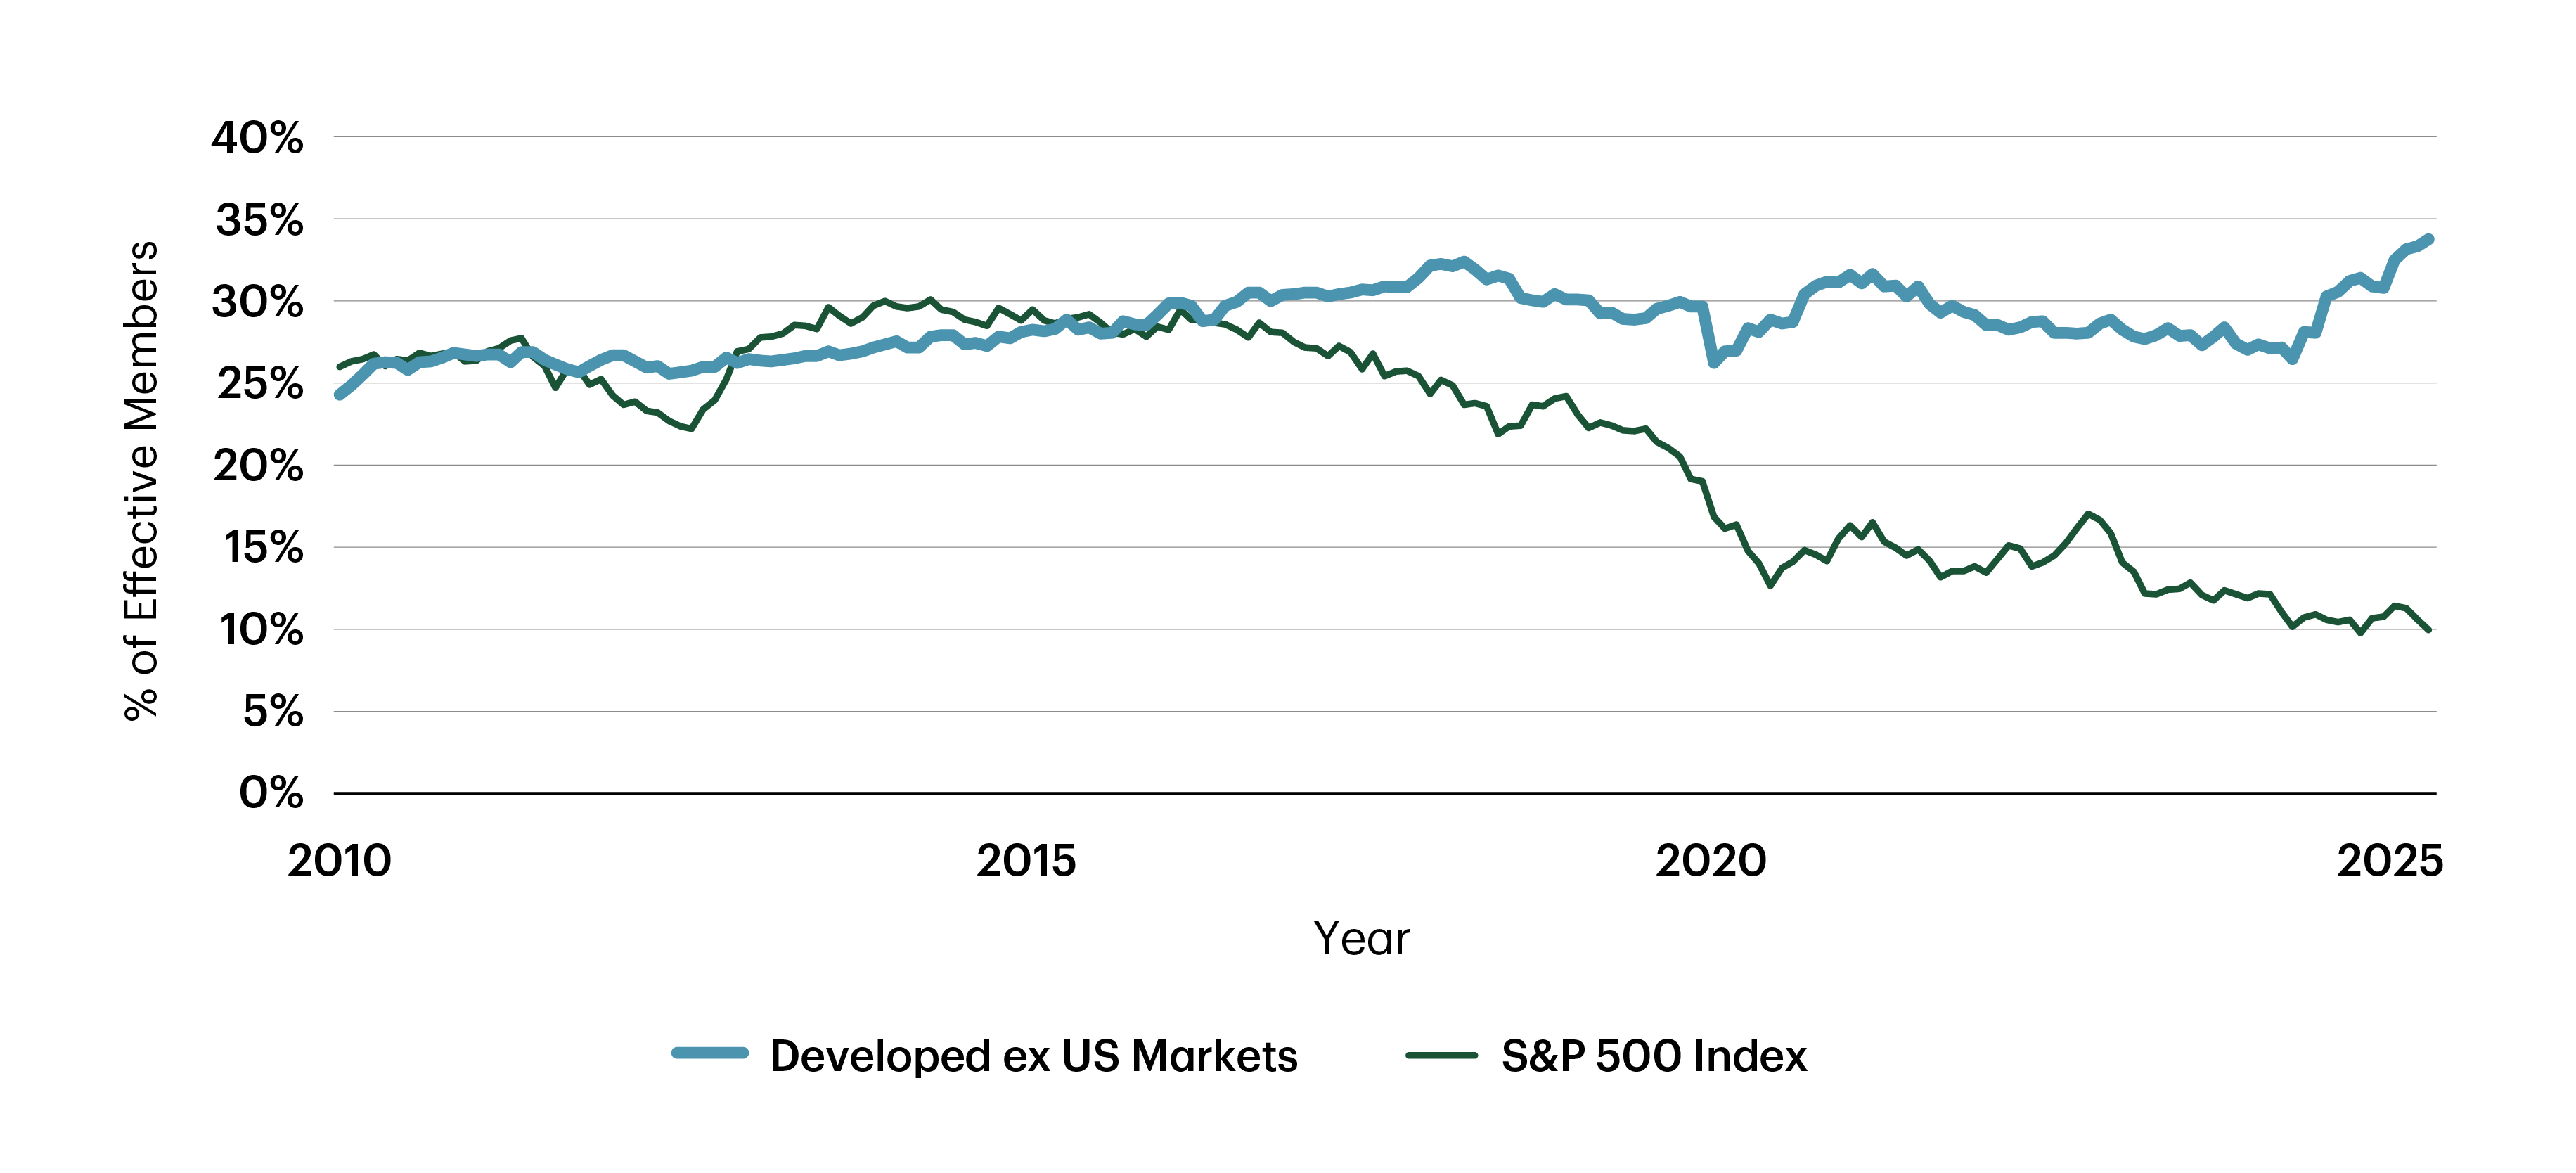
Source: Bloomberg Finance L.P., TDAM. As of June 30, 2025.
This growing concentration also shows up in risk metrics. The top 10 S&P 500 stocks now account for nearly half of the total volatility in the index (see figure 3). This level of risk concentration is increasingly disproportionate to the number of companies investors assume they’re exposed to when buying into a broad index fund.
Figure 3: Weight and Risk Contribution of Top 10 Stocks – S&P 500
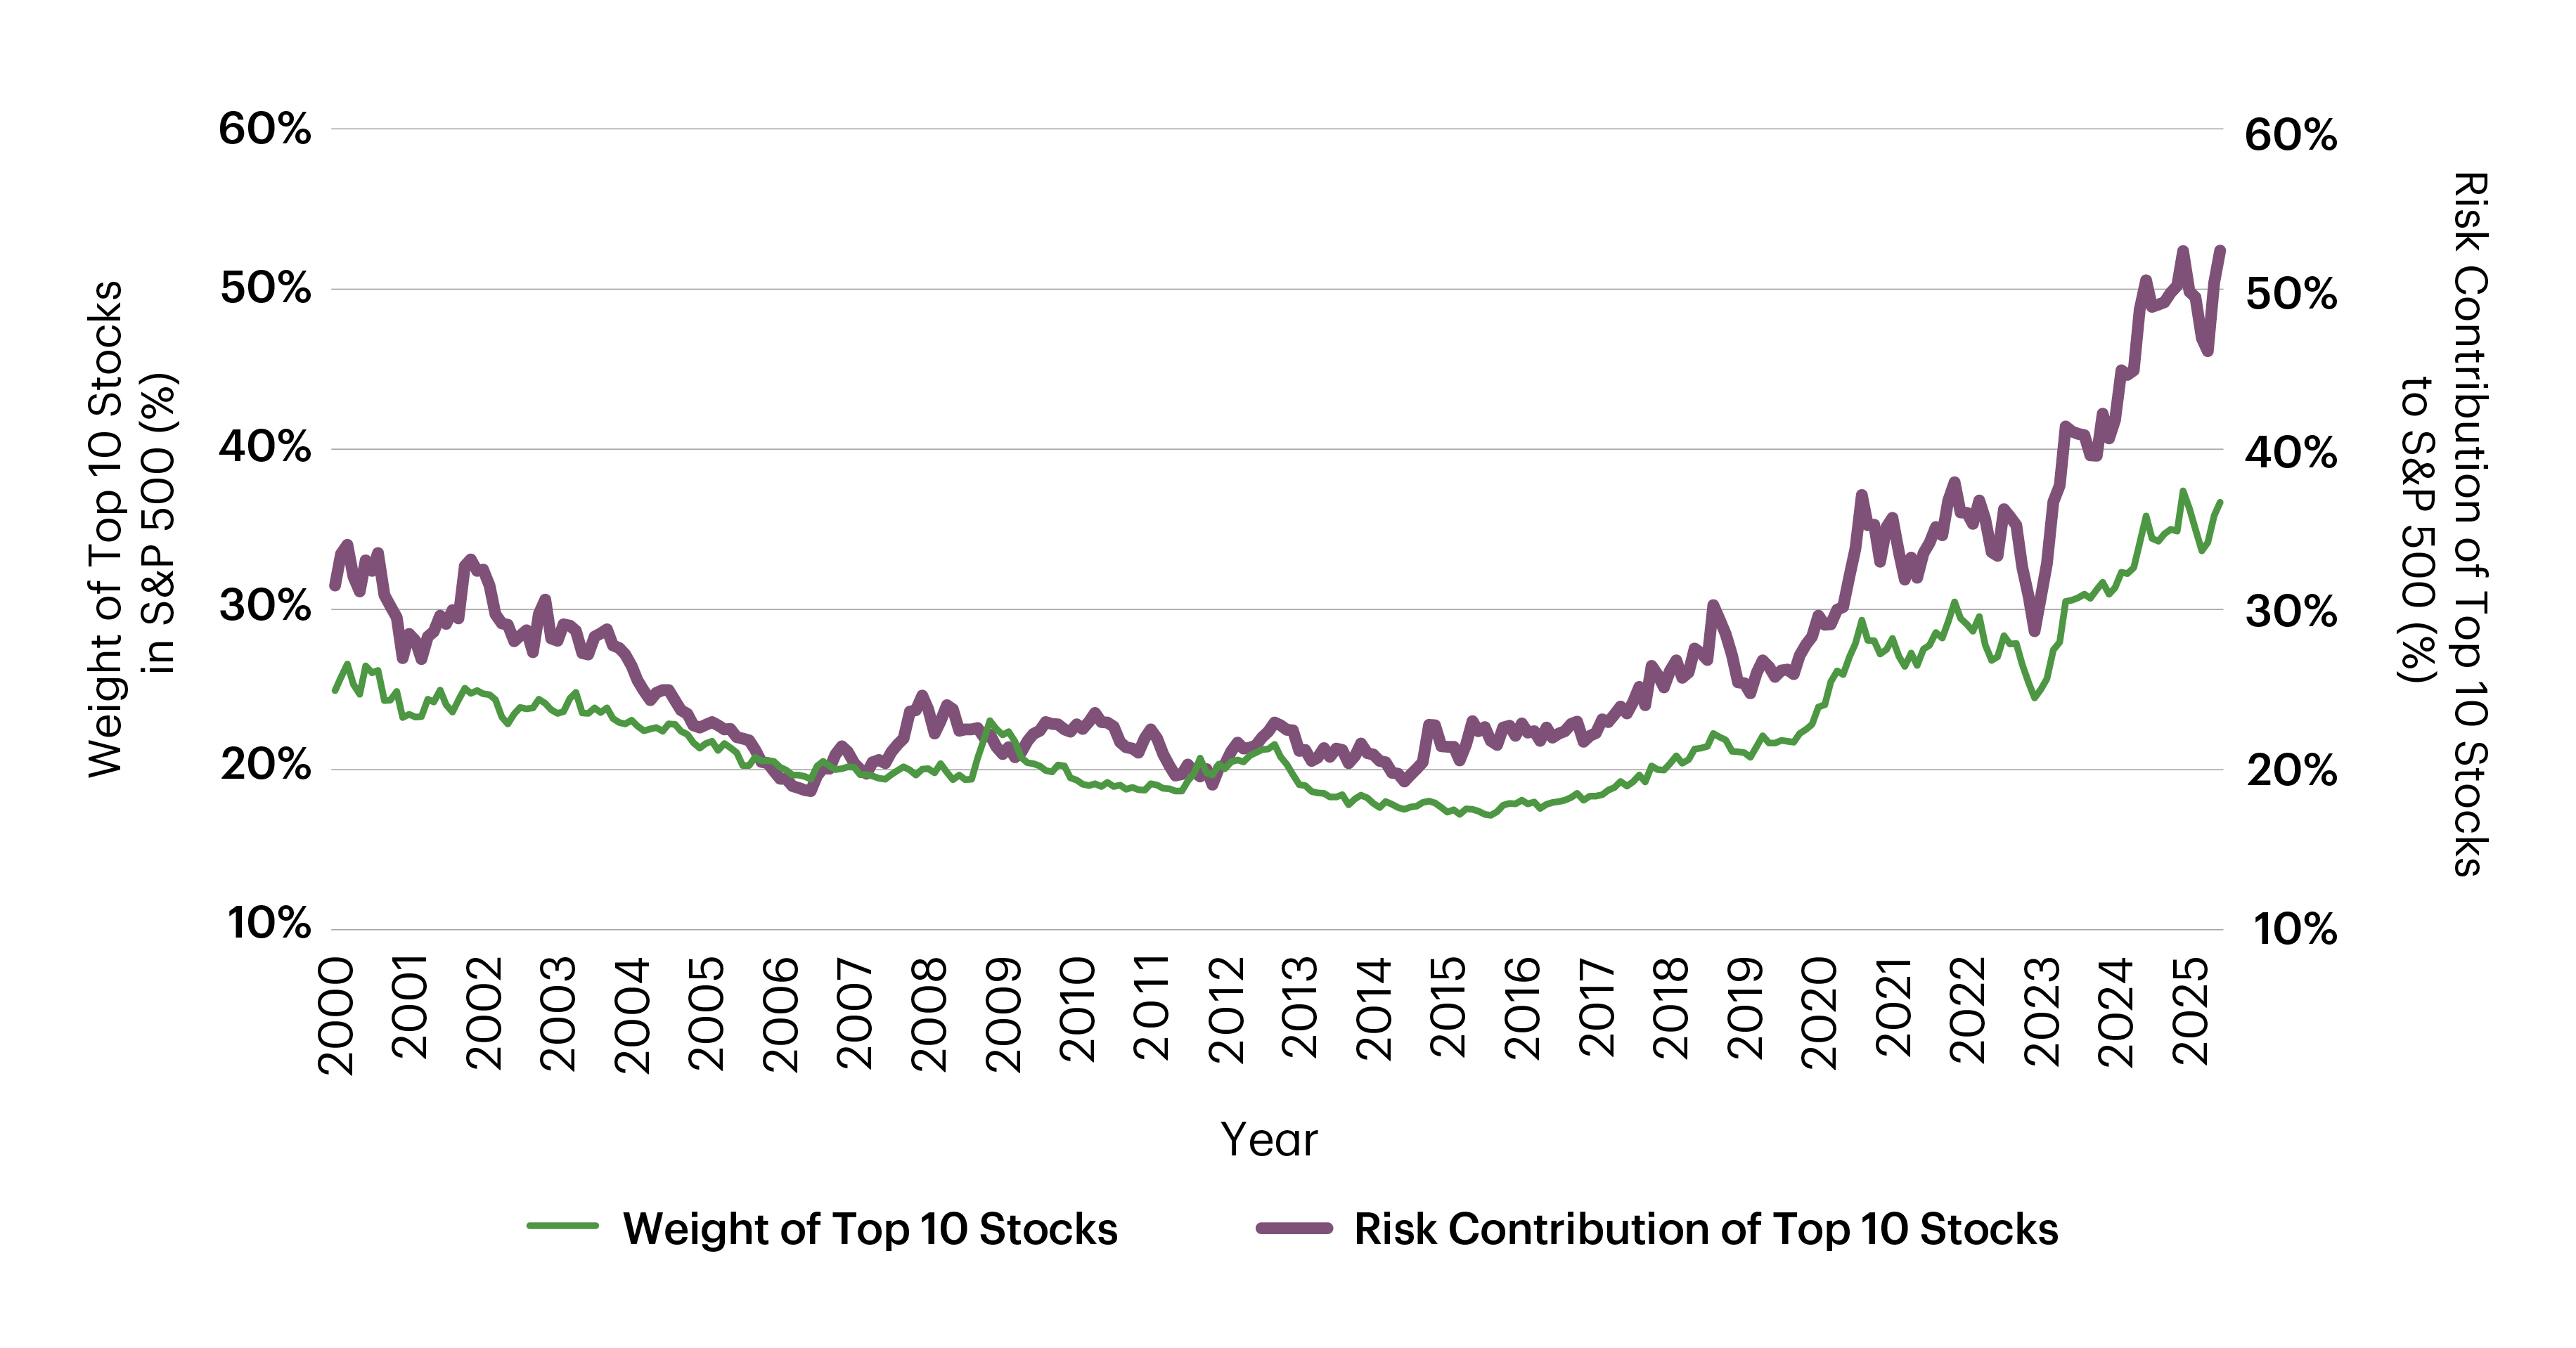 Source: TDAM, S&P Global Inc. As of June 30, 2025.
Meanwhile, investors are already contending with a series of powerful headwinds: tariffs, geopolitical conflict in the Middle East, volatile energy prices, a surging U.S. fiscal deficit, and a weakening U.S. dollar. Any of these risks could be the tipping point that breaks the momentum behind today’s most crowded markets. In such an environment, a highly concentrated portfolio may be particularly vulnerable. That’s why staying diversified, not just by name count but by risk exposure, is more important than ever.
How Low Vol May Help Manage Concentration
One approach that may offer a measure of resilience is low volatility investing. Low volatility strategies are designed to reduce exposure to stocks with high price variability and often avoid the largest, most volatile names that dominate market-cap indices. Rather than chasing performance, low volatility portfolios aim to manage risk more deliberately, seeking smoother returns over full market cycles.
The advantages of this approach become more visible during market stress. For example, during the trade-related market sell-offs of April 2025, high-beta stocks, especially those in the tech sector, led the declines. In contrast, lower volatility strategies, such as the TD Q U.S. Low Volatility ETF, remained relatively stable, offering a buffer against shocks. (As of June 30, 2025, the TD Q U.S. Low Volatility ETF - whose inception date is May 26, 2020 - has posted a one-year return of 12.26 %, a three-year return of 8.03% and a five-year return of 9.21%.)
Figure 4: Capital Drawdown
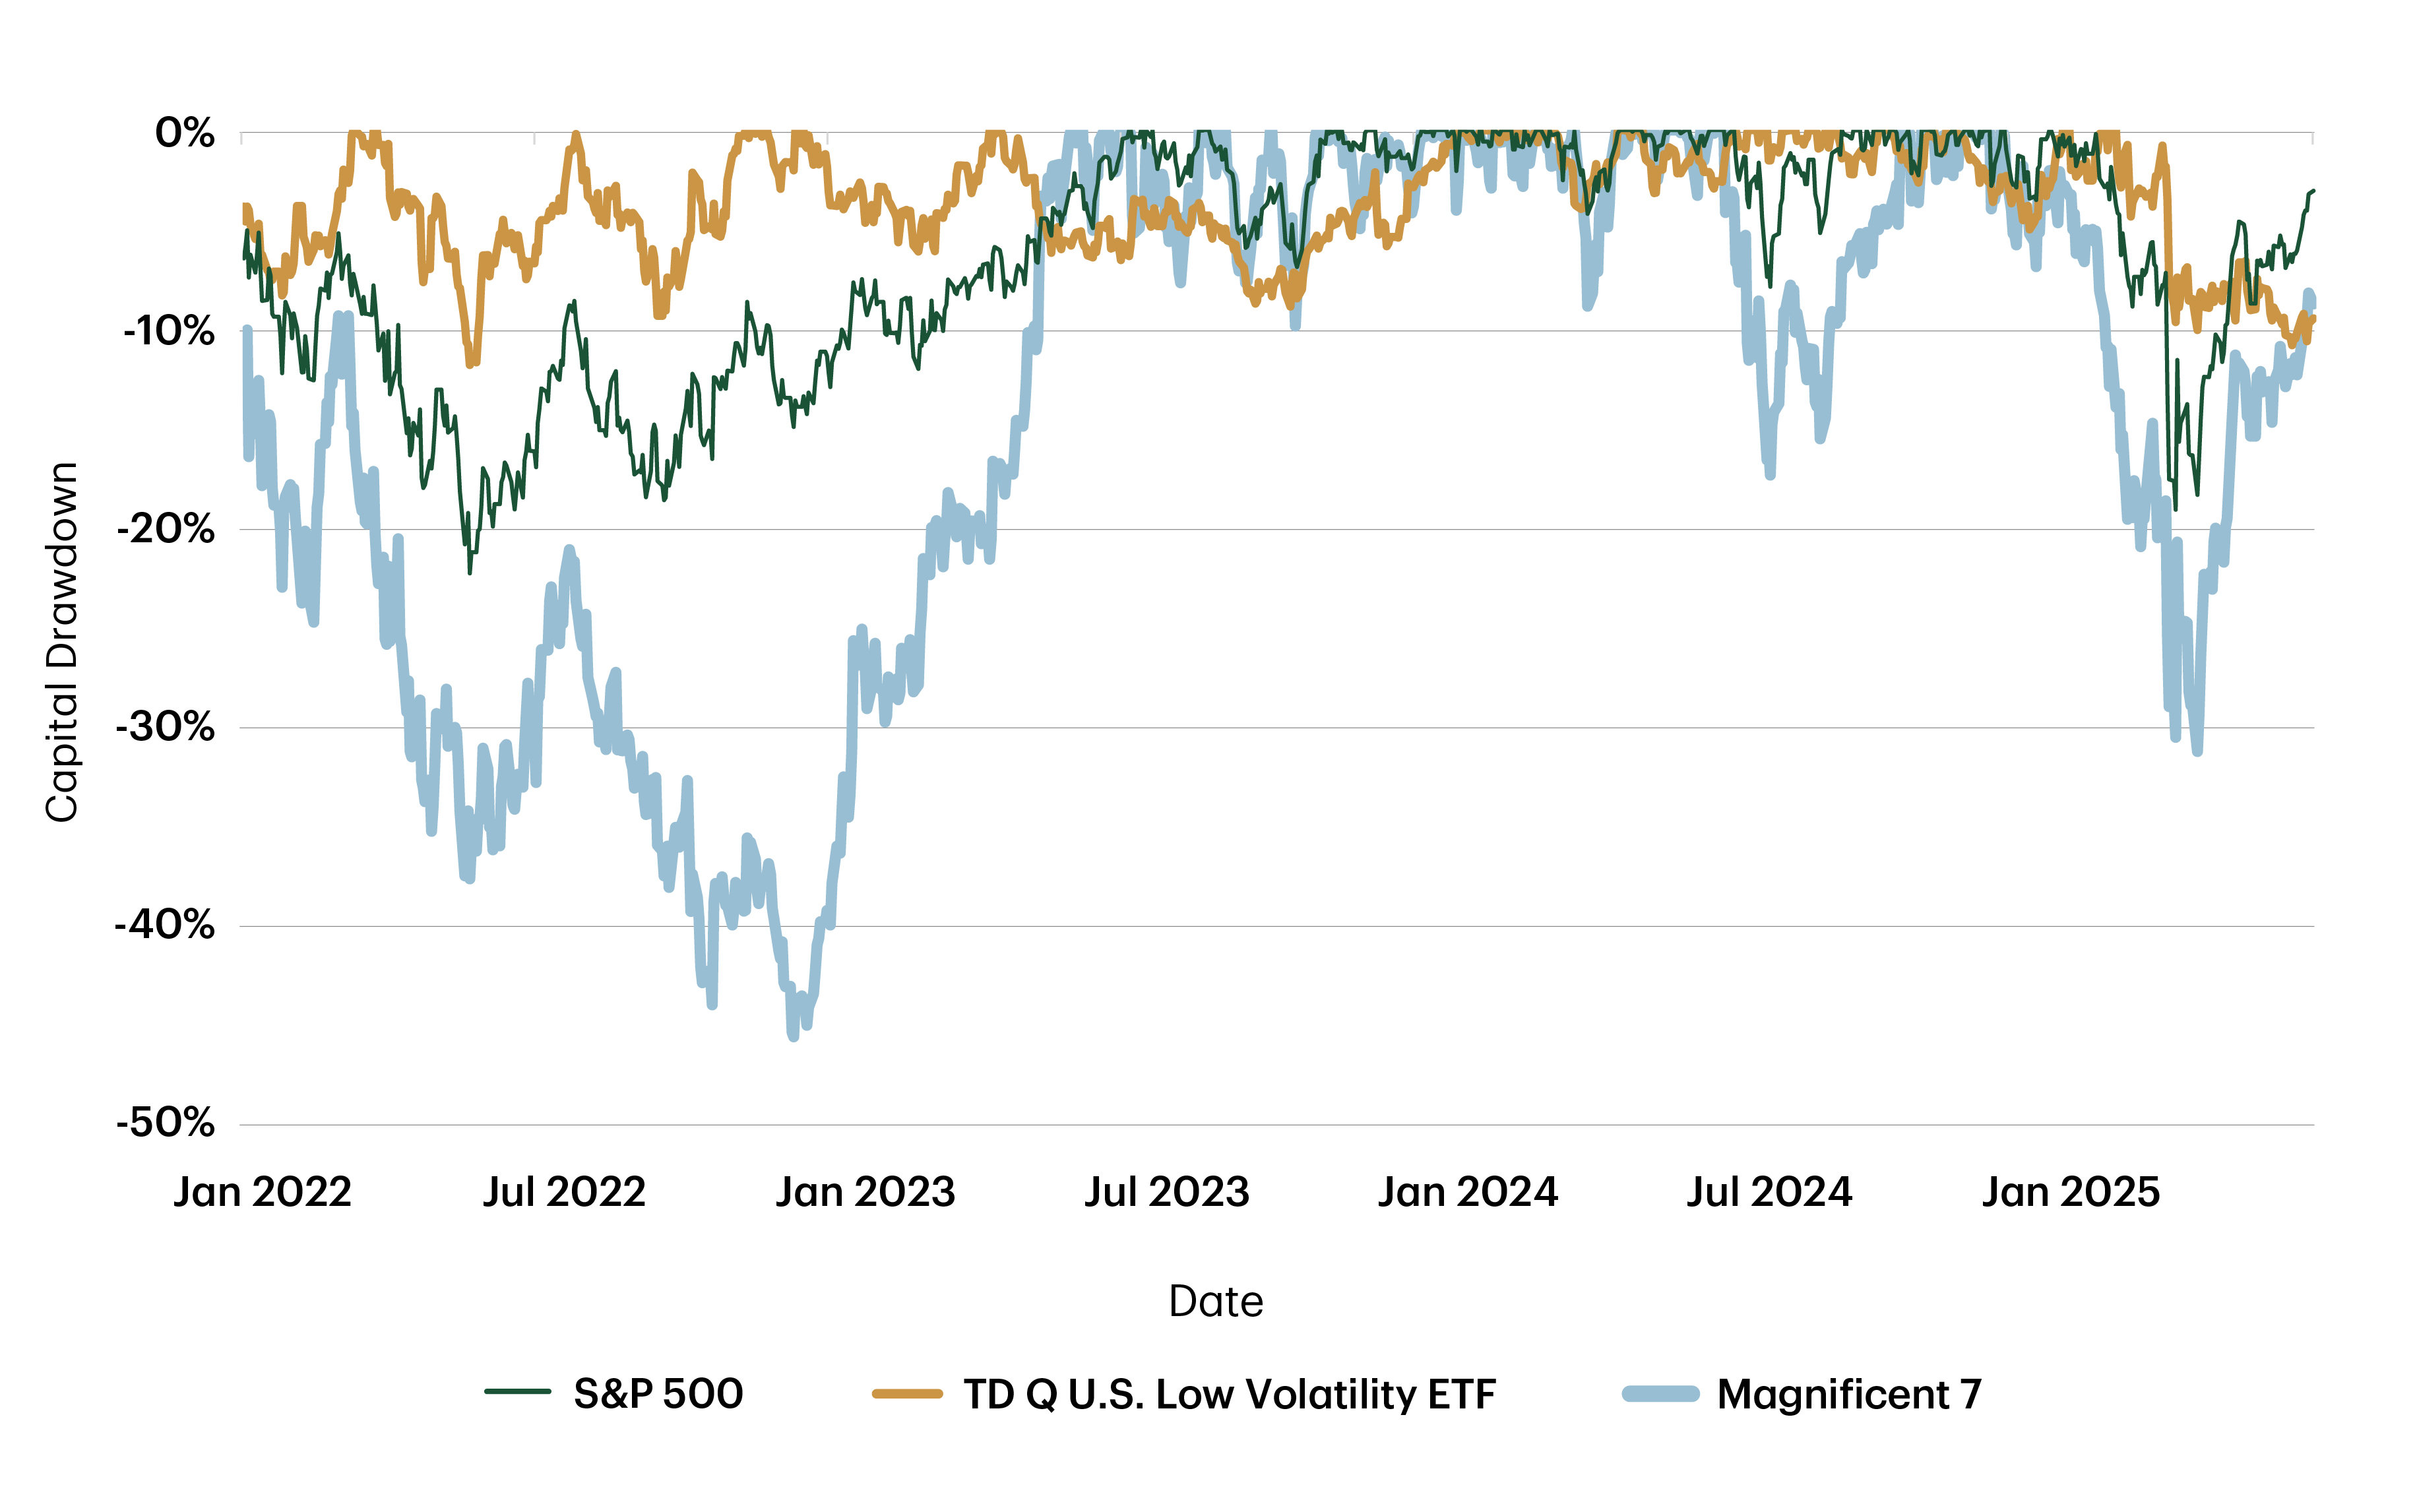
Source: TDAM, Bloomberg Finance L.P. As of June 30, 2025.
Diversification As a Safeguard
Market-cap-weighted indices have generally provided stronger than normal returns over the past decade, especially against the backdrop of low interest rates, ample liquidity and consistent outperformance of tech stocks. But investors should ask themselves whether those conditions will continue indefinitely. Are they prepared for what comes next if the same 10 names can’t carry the market into the next decade?
It’s difficult to imagine a sustainable future where just a handful of stocks represent one-third of the entire S&P 500. If history is any guide, such extreme concentration rarely ends without a shakeout. For long-term investors, diversification is a safeguard. Low volatility portfolios may be one of the few strategies positioned to help navigate the fallout of an increasingly imbalanced market.
Disclosures
The information contained herein has been provided by TD Asset Management Inc. and is for information purposes only. The information has been drawn from sources believed to be reliable. Graphs and charts are used for illustrative purposes only and do not reflect future values or future performance of any investment. The information does not provide financial, legal, tax or investment advice. Particular investment, tax, or trading strategies should be evaluated relative to each individual's objectives and risk tolerance.
Commissions, management fees and expenses all may be associated with investments in exchange- traded funds (ETFs). Please read the prospectus and ETF Facts before investing. ETFs are not guaranteed, their values change frequently and past performance may not be repeated. ETF units are bought and sold at market price on a stock exchange and brokerage commissions will reduce returns. Index returns do not represent ETF returns. The indicated rates of return are the historical total returns for the periods including changes in unit value and reinvestment of all distributions and do not take into account redemption, commission charges or income taxes payable by any unitholder that would have reduced returns. Past performance may not be repeated.
Certain statements in this document may contain forward-looking statements (“FLS”) that are predictive in nature and may include words such as “expects”, “anticipates”, “intends”, “believes”, “estimates” and similar forward-looking expressions or negative versions thereof. FLS are based on current expectations and projections about future general economic, political and relevant market factors, such as interest and foreign exchange rates, equity and capital markets, the general business environment, assuming no changes to tax or other laws or government regulation or catastrophic events. Expectations and projections about future events are inherently subject to risks and uncertainties, which may be unforeseeable. Such expectations and projections may be incorrect in the future. FLS are not guarantees of future performance. Actual events could differ materially from those expressed or implied in any FLS. A number of important factors including those factors set out above can contribute to these digressions. You should avoid placing any reliance on FLS.
Any indices cited are widely accepted benchmarks for investment and represent non-managed investment portfolios. It is not possible to invest directly in an index. Information about the indices allows for the comparisons of an investment strategy's results to that of a widely recognized market index. Results for an index do not reflect trading commissions and costs. Index volatility may be materially different from a strategy's volatility and portfolio holdings may differ significantly from the securities comprising the index.
Bloomberg and Bloomberg.com are trademarks and service marks of Bloomberg Finance L.P., a Delaware limited partnership, or its subsidiaries. All rights reserved.
TD ETFs are managed by TD Asset Management Inc., a wholly-owned subsidiary of The Toronto-Dominion Bank.
®The TD logo and other TD trademarks are the property of The Toronto-Dominion Bank or its subsidiaries
TDAM Connections at a Glance:
You might also be interested in:

TDAM Talks Podcast

A Look Into Our Best Thinking

Explore our Insights