

You are now leaving our website and entering a third-party website over which we have no control.
Q2 2025 Quarterly Market Review
Highlights:
SECURITIES AND INVESTMENTS | ||||
NOT A DEPOSIT | NOT FDIC-INSURED | NOT BANK GUARANTEED | MAY LOSE VALUE | |
Quarterly Highlights
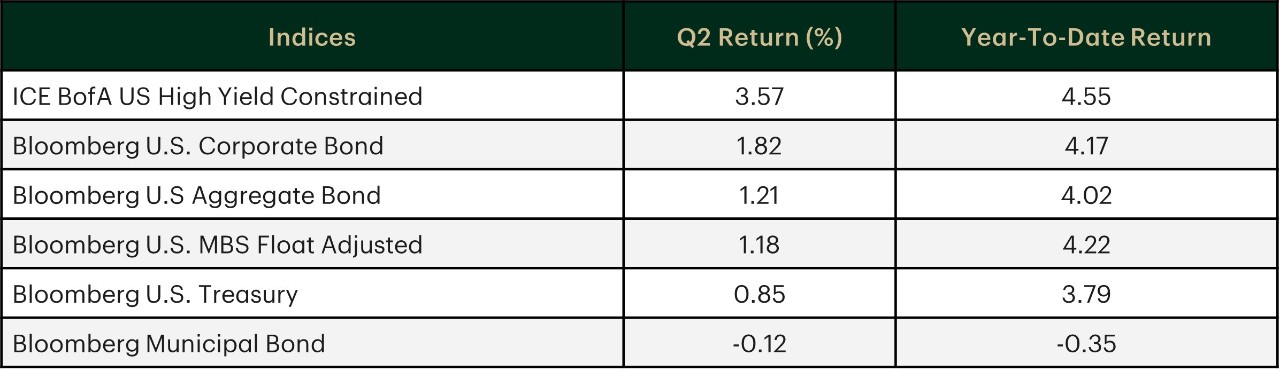
Fixed Income:
- The Bloomberg U.S. Aggregate Bond Index advanced by 1.21%.
- Treasury prices were mixed, with longer-term Treasuries underperforming short- and intermediate-term maturities.
- The 10-year Treasury yield rose 2 basis points (bps) to 4.23%, while the 2-year Treasury yield fell 18 bps to 3.71%.
U.S. Equities:
- The S&P 500 Index advanced 10.94%, while the technology-heavy Nasdaq Composite Index surged 17.96%.
- Eight of the 11 sectors in the S&P 500 Index produced positive returns. The information technology sector led.
- Large-cap stocks outperformed small-cap stocks, while growth stocks outpaced their value counterparts
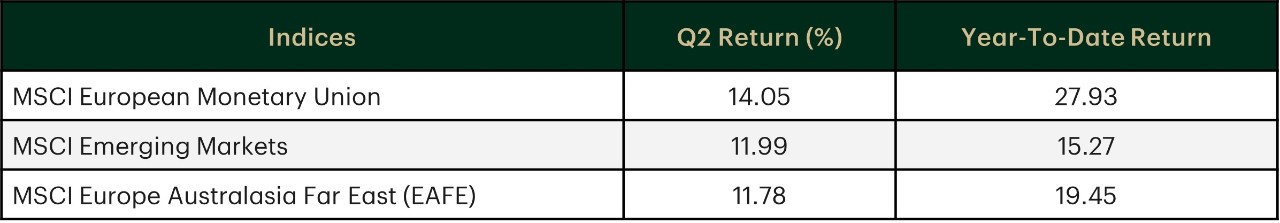
International Stocks:
- International developed and emerging markets generally outperformed their U.S. peers, driven by U.S. dollar weakness.
Source: Morningstar Direct as of June 30, 2025, TD Wealth Chief Investment Office. Returns are presented on a total return basis.
U.S. fixed income markets posted gains in the second quarter, led by credit markets. Treasuries saw mixed performance, with the yield curve steepening as attention shifted away from monetary policy and toward fiscal policy risks. Concerns grew around debt sustainability following the introduction of the "One, Big, Beautiful Bill Act.”
The 2-year Treasury yield fell 18 bps to 3.71%, while the 10-year yield rose 2 bps to 4.23%. As a result, the spread between 2-year and 10-year Treasuries steepened to 52 bps.
The Federal Reserve (Fed) left its policy rate unchanged in the second quarter. In the press conference following its June meeting, Fed Chair Jerome Powell said that uncertainty about the economic outlook has decreased but still remains high. The Fed’s Summary of Economic Projections now takes into account recent tariff announcements, forecasting slightly higher inflation and slower economic growth for this year. The median projection of Fed committee members continues to imply 50 bps of cuts this year.
Strength in credit markets supported the broad U.S. bond market, with the Bloomberg Aggregate Bond Index ending the quarter higher by 1.21%. Treasury prices were mixed, with longer-term Treasuries underperforming short- and intermediate-term maturities. Following the early-quarter volatility tied to "Liberation Day," credit spreads narrowed in both investment-grade and high-yield bond markets. Demand remained strong across credit, supported by attractive all-in yields. Municipal bonds underperformed Treasuries and ended the quarter modestly lower. Weakness was driven by a challenging technical environment, ongoing concerns about government spending, and uncertainty surrounding tax-exemption status.
Yield Curve Steepens on Fiscal Concerns
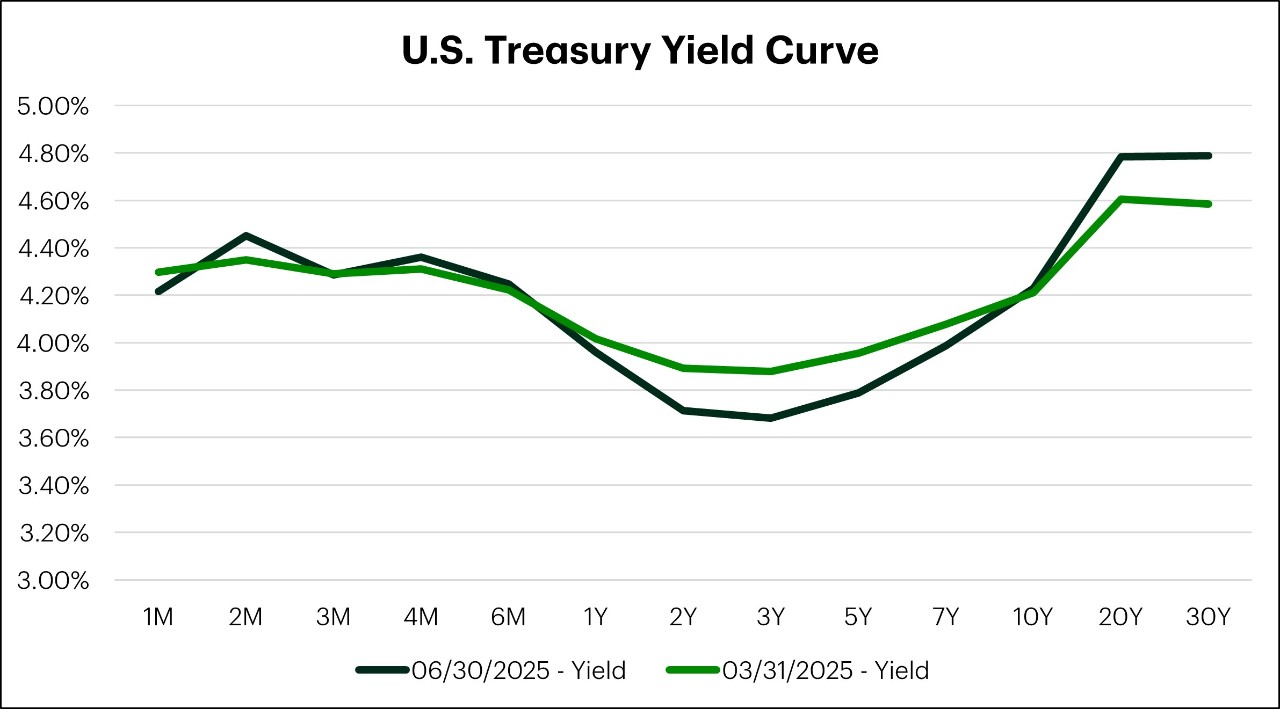
Source: FactSet as of June 30, 2025, TD Wealth Chief Investment Office.
Please see Important Information

Source: Morningstar Direct as of June 30, 2025, TD Wealth Chief Investment Office.
U.S. stocks rebounded in the second quarter after a challenging start to the year. Key drivers supporting investor enthusiasm in Q2 included progress on trade policy, earnings that exceeded expectations, and resilient labor market data.
Although stocks closed the quarter higher, Q2 proved to be highly eventful and volatile. Investor concern early in the quarter centered around the April 2 "Liberation Day" announcement, which delivered much higher tariffs than expected. The plan introduced a 10% universal tariff and imposed higher reciprocal tariffs on approximately 60 countries, with some rates reaching 50%. The announcement quickly shifted the market narrative on tariffs, from a negotiating tool to a structural policy change, leading the S&P 500 Index to decline by roughly 12% over several days.
On April 9, President Trump announced a 90-day pause on higher-level reciprocal tariffs to allow for negotiations. However, China was excluded from the pause, prompting both sides to take turns raising tariffs to unfathomable levels, effectively instituting mutual trade embargoes. These trade restrictions ultimately forced both sides to soften their rhetoric, laying the groundwork for a tentative détente in May.
With trade concerns beginning to ease, markets turned their focus to fundamentals. First-quarter earnings were strong, with S&P 500 companies reporting 12.7% earnings growth (year-over-year), the second consecutive quarter of double-digit earnings, and well ahead of the 7.2% expected at the start of earnings season. Additionally, the labor market continued to show resiliency, with employment data exceeding expectations in Q2. Despite elevated geopolitical tensions in the Middle East in June, U.S. equities closed the quarter on a strong note.
For the three months ended June 30, 2025, the S&P 500 Index rose by 10.94% and the Nasdaq Composite Index surged by 17.96%. Eight of the 11 sectors in the S&P 500 Index performed positively. Information technology and communication services were the top sectors, rising 23.71% and 18.49% respectively. The energy sector was the weakest, declining 8.56%. Large-cap stocks (S&P 500 Index) rose 10.94%, outperforming small-caps (Russell 2000 Index), which increased 8.50%. Growth stocks (Russell 1000 Growth Index) rose 17.84%, outperforming value stocks (Russell 1000 Value Index), which rose 3.79%.
S&P 500 Index – Sector Returns (%)
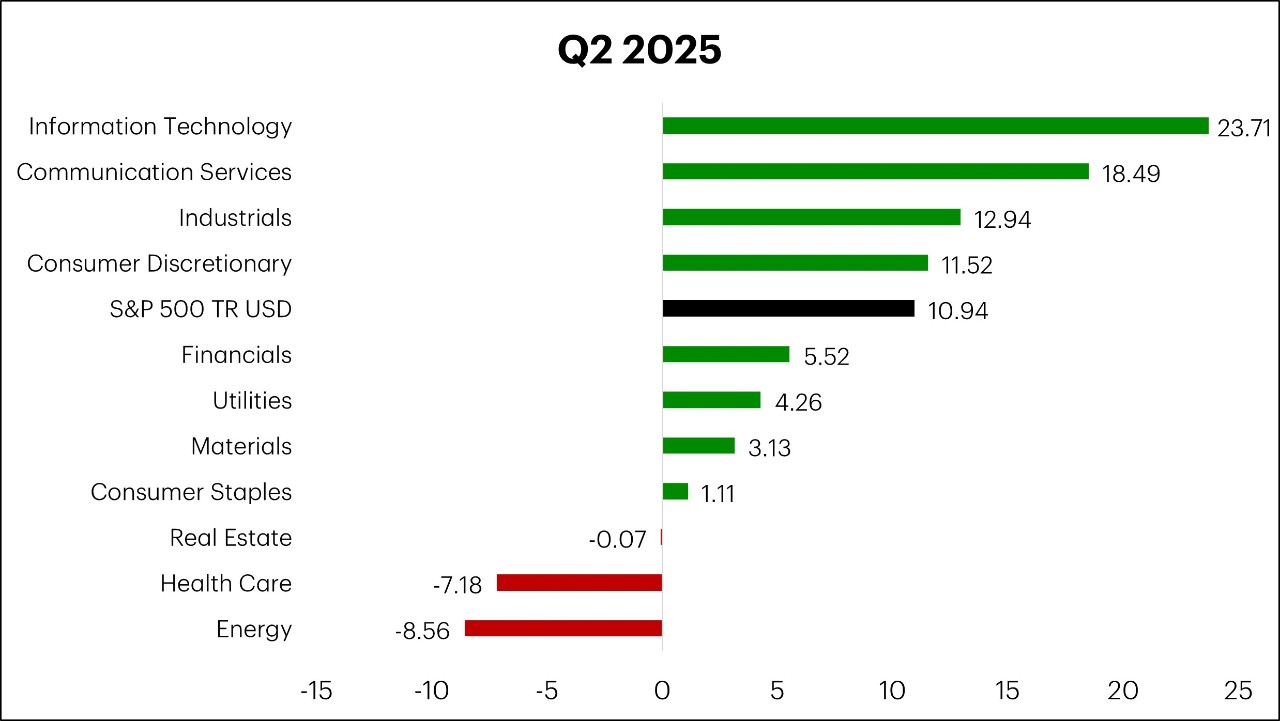
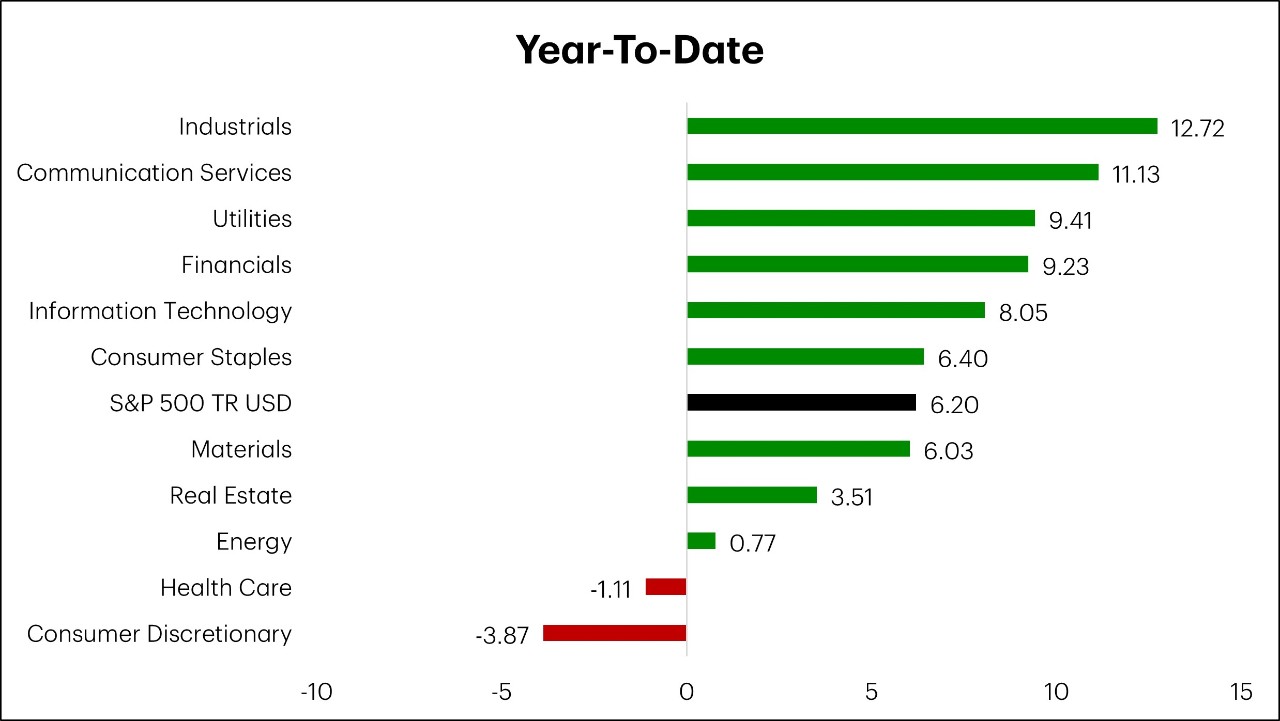
Source: Morningstar Direct as of June 30, 2025, TD Wealth Chief Investment Office. Returns to be presented on a total return basis.
Please see Important Information
Source: Morningstar Direct as of June 30, 2025, TD Wealth Chief Investment Office. Returns are presented as net index returns. Index returns calculated in U.S. dollars.
International developed equity markets outperformed their U.S. peers in the second quarter when measured in U.S dollar terms, due to currency effects. The U.S. dollar weakened by 7.04% relative to a basket of major currencies, boosting performance for international equities when reported in U.S. dollars.
Eurozone markets, represented by the MSCI European Monetary Union Index, rose 5.01% in local currency. The European Central Bank cut interest rates twice during the quarter, by a total of 50 bps as inflation hit its 2% target. Stronger-than-expected earnings, fiscal spending, and relatively attractive valuations compared to U.S. equities also supported the region's performance, alongside currency tailwinds.
Japanese equities rebounded after a 10% decline in the first quarter, with the Nikkei 225 gaining 13.83% in local currency terms. The Bank of Japan maintained its accommodative stance, holding interest rates at 0.50% after issuing a 25-bps hike in January. This helped keep the yen weak in Q2, benefiting exporters.
Finally, emerging market equities rose markedly. The MSCI Emerging Markets Index, in local currency terms, rose 7.93%. The weakest among the top four emerging markets was China, where the MSCI China Index rose 2.56% in local currency. Tough negotiations with the U.S. generated significant uncertainty, leading the People’s Bank of China to cut interest rates and lower reserve requirements for banks. Additionally, weak domestic economic data continued to weigh on sentiment.
Please see Important Information
Connect with a TD Wealth Advisor
Our TD Wealth Advisors are available for a consultation to start planning for your future.