You are now leaving our website and entering a third-party website over which we have no control.
What is the TD Direct Investing Index (DII)?
The DII provides data and insights relating to historical self-directed investor activity. By looking at this historical activity, it can help us see how investors reacted to economic and financial market events.
The DII information below takes into consideration data for the full calendar month. Want to see how the DII works? Watch our explainer video. You can also learn more here.
Historic market trends
April 2024: Overall self-directed investor sentiment was bullish. Watch this video for market highlights.
May 2024: Overall self-directed investor sentiment was bearish. Watch this video for market highlights.

July 2024: Overall self-directed investor sentiment was bearish. Watch this video for market highlights.
August 2024: Overall self-directed investor sentiment was bearish. Watch this video for market highlights.

June 2024: Overall self-directed investor sentiment was bearish. Watch this video for market highlights.

September 2024: Overall self-directed investor sentiment was bearish. Watch this video for market highlights.

October 2024: Overall self-directed investor sentiment was bearish. Watch this video for market highlights.

November 2024: Overall self-directed investor sentiment was bearish. Watch this video for market highlights.
December 2024: Overall self-directed investor sentiment was bearish. Watch this video for market highlights.

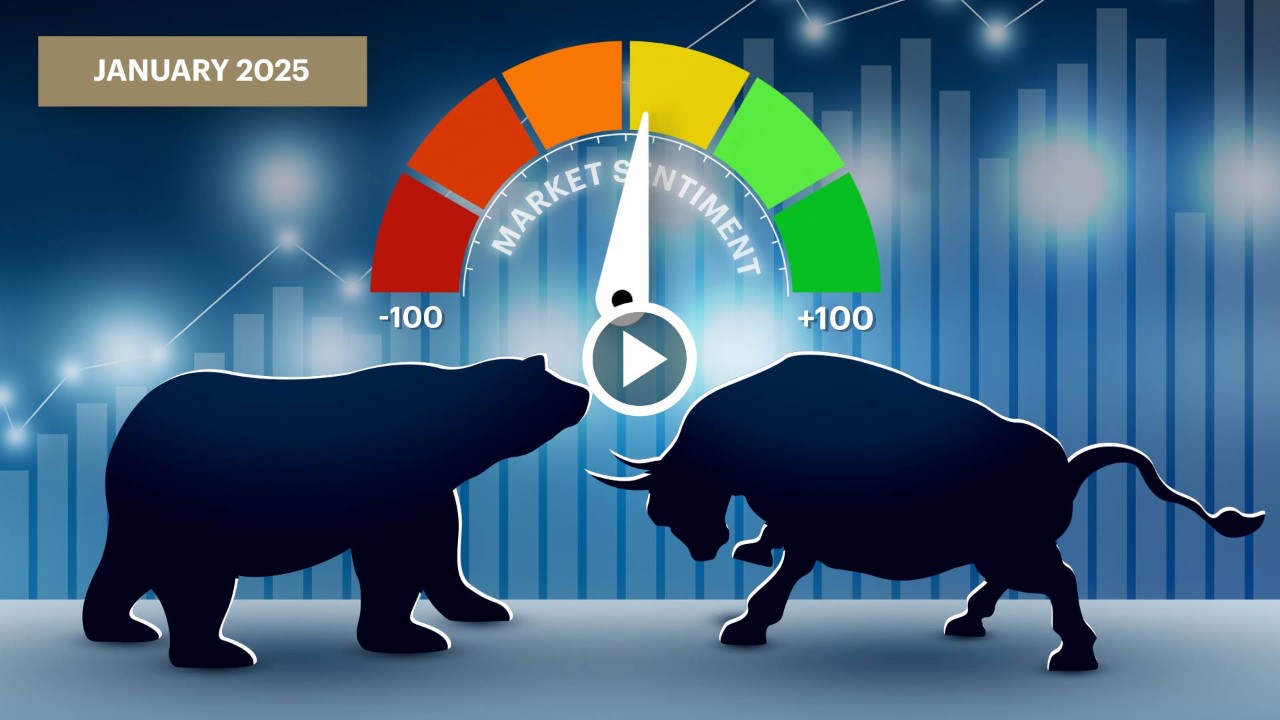
January 2025: Overall self-directed investor sentiment was bearish. Watch this video for market highlights.
February 2025: Overall self-directed investor sentiment was bearish. Watch this video for market highlights.

March 2025: Overall self-directed investor sentiment was bearish. Watch this video for market highlights.

April 2025: Overall self-directed investor sentiment was bearish. Watch this video for market highlights.

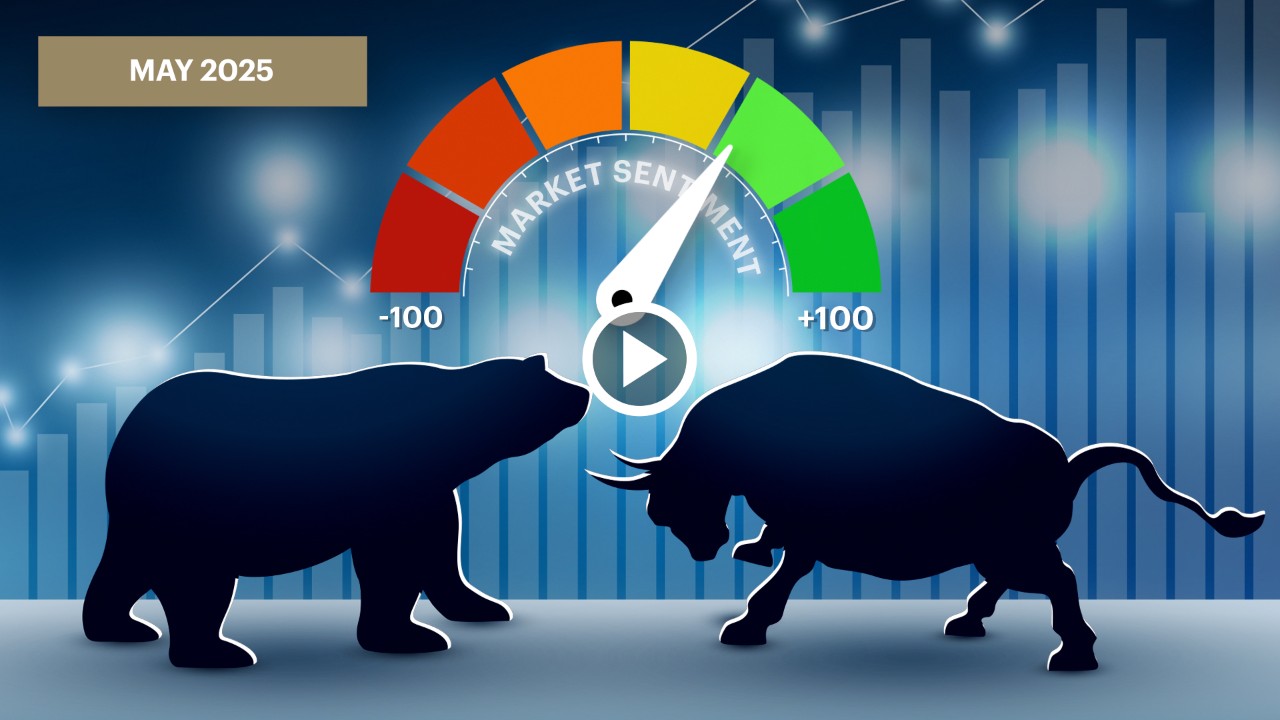
May 2025: Overall self-directed investor sentiment was bearish. Watch this video for market highlights.
June 2025: Overall self-directed investor sentiment was bearish. Watch this video for market highlights.
July 2025: Overall self-directed investor sentiment was bearish. Watch this video for market highlights.

August 2025: Overall self-directed investor sentiment was bearish. Watch this video for market highlights.

September 2025: Overall self-directed investor sentiment was bearish. Watch this video for market highlights.
October 2025: Overall self-directed investor sentiment was bearish. Watch this video for market highlights.

November 2025: Overall self-directed investor sentiment was bearish. Watch this video for market highlights.

December 2025: Overall self-directed investor sentiment was bearish. Watch this video for market highlights.

January 2026: Overall self-directed investor sentiment was bearish. Watch this video for market highlights.

February 2026: Overall self-directed investor sentiment was bearish. Watch this video for market highlights.

March 2026: Overall self-directed investor sentiment was bearish. Watch this video for market highlights.

April 2026: Overall self-directed investor sentiment was bullish. Watch this video for market highlights.

May 2026: Overall self-directed investor sentiment was bullish. Watch this video for market highlights.

Most popular securities (self-directed investors)
-
Bought
-
Sold
-
Held
Last month's trend (self-directed investors)
Asset allocation and sector rotation refer to the average month-to-month changes in investments inside Direct Investors' portfolios. It is not included in the DII sentiment score. The data tracks the averages of how much traders changed their investments in each asset type or industry sector in the previous month.
This data can help investors to observe additional market trends and investor behaviours as it's based on where traders decided to invest their money rather than looking at the most heavily traded stocks. Learn more about asset classes and sectors in our FAQ.
-
Asset allocation comparison
-
Industry sector
allocation comparison
The asset allocation comparison methodology has changed as of March 2024. We implemented a process to improve the asset allocation comparison methodology by adjusting the data modelling. Comparisons between asset allocation data prior to this change and after this change may produce different comparison results than between periods with the same methodology.
Invest with confidence
Stay on top of the market with TD Direct Investing.
Sorry, we didn't find any results. You could check for misspelled words or try a different term or question.
We're sorry. Service is currently unavailable.
We found a few responses for you:
We matched that to:
Popular Questions
Helpful Related Questions
Did you find what you were looking for?
Thank you
We're sorry. Service is currently unavailable.
Sorry this didn't help. Would you leave us a comment about your search?
Thank you
See you in a bit
TD Bank Group is not responsible for the content of the third-party sites hyperlinked from this page, nor do they guarantee or endorse the information, recommendations, products or services offered on third party sites.
Third-party sites may have different Privacy and Security policies than TD Bank Group. You should review the Privacy and Security policies of any third-party website before you provide personal or confidential information.
Site Index
TD Personal Banking
- Personal Home
- My Accounts
- How To
- Today's Rates
- Accounts (Personal)
- Chequing Accounts
- Savings Accounts
- Student Account
- Credit Cards
- Aeroplan Miles
- Travel Rewards
- Cash Back
- No Annual Fee
- Low Rate
- U.S. Dollar
- Mortgages
- Borrowing
- Saving and Investing
- GIC & Term Deposits
- Mutual Funds
- TFSA - Tax-Free Savings Account
- RSP - Retirement Savings Plan
- RIF - Retirement Income Options
- RESP - Education Savings Plan
- RDSP - Disability Savings Plan
- Precious Metals
- Insurance
- Travel Medical Insurance
- All Products
- Students
- New To Canada
- Cross Border Banking
- Foreign Exchange Services
- Ways to Pay
- Ways to Bank
- Green Banking
TD Small Business Banking
- Small Business Home
- Accounts (Business)
- Chequing Account
- Savings Account
- U.S. Dollar Account
- AgriInvest Account
- Cheque Services
- Credit
- Overdraft Protection
- Line of Credit
- Business Credit Cards (Filtered)
- Loan
- Business Mortgage
- Canada Small Business Financial Loan
- Agriculture Credit Solutions
- TD Auto Finance Small Business Vehicle Lending
- Invest for your Business
- Advice for your Profession or Industry
- TD Merchant Solutions
- Foreign Currency Services
- Payroll Services
- Employer Services
TD Corporate
Other TD Businesses
Transcript
[MUSIC PLAYING]
- The results are in. And the TD Direct Investing Index moved lower in May, suggesting self-directed investors turned a little less bullish. Here are three big takeaways. First, the TD Direct Investing Index, which measures sentiment in a range from minus 100 for very bearish to plus 100 for very bullish, slipped seven points to plus 24 in May. That's down from the plus 31 we saw in April and below the plus 36 from the same time last year.
Second, when we break things out by age group, sentiment for the Gen Z and millennials born after 1981 slipped one point to close at plus 4 in May. And finally, active traders, defined as those making 30 or more trades in the past three months, turned more optimistic. Their sentiment jumped 29 points to plus 21, moving from bearish into bullish territory.
And semiconductor stocks rallied last month on growing optimism around AI infrastructure spending. Among the top bought stocks by active traders and the youngest investors were chipmakers Micron, NVIDIA, and Intel.
And for more information on the TD Direct Investing Index, see the following link to navigate to the TD DII page. And that's your TD Direct Investing Index highlights for May 2026.
[MUSIC PLAYING]
Transcript
[MUSIC PLAYING]
- The results are in. And the TD Direct Investing Index soared in April, indicating more bullish sentiment among self-directed investors. Here are three key takeaways.
First up, the TD Direct Investing Index, which measures sentiment in a range from minus 100 for very bearish to plus 100 for very bullish-- it surged last month, rising 53 points to plus 31. When compared to this time one year ago, when President Trump's Liberation Day tariffs sparked significant stock market volatility, market optimism was up a whopping 38%.
All right. Secondly, sentiment for technology climbed out of the cellar in April, jumping 23 points to plus 19. That's the highest of any sector. And April marked a sharp reversal from the broad risk-off sell-off in the prior month, led by a rally in technology stocks. Shopify, NVIDIA, and Micron Technology were among the top bought stocks during the month.
And finally, when we break things out by investor type, sentiment for long-term investors, those with up to 29 trades in the past three months surged into bullish territory, with a whopping 63-point gain to close at plus 41 in April. And for more information on the TD Direct Investing Index, see the following link to navigate to the TD DII page. And that's the TD Direct Investing Index highlights for April 2026. See you next month.
[MUSIC PLAYING]
Transcript
[MUSIC PLAYING]
- The results are in, and the TD Direct Investing Index cooled off in March, indicating less bullish sentiment among self-directed investors. Here are three key takeaways. First up, the TD Direct Investing Index, which measures sentiment in a range from minus 100 for very bearish to plus 100 for very bullish, took a hit last month, sliding 30 points to minus 22. But it's still 24 points higher than this time one year ago.
Second, sentiment for energy stocks was the highest of any sector in March, jumping 12 points to plus 17. Oil prices pushed higher on geopolitical tension and supply worries, lifting energy stocks with them. Canadian Natural Resources, Whitecap Resources, and Cenovus Energy were among the top-bought stocks during the month.
And even though sentiment slipped across every age group, Gen Z and millennials, those born in 1981 and after, held up the best. Their sentiment was basically flat in March, sitting at plus 1. And for more information on the TD Direct Investing Index, see the following link to navigate to the TD DII page. And that's your TD Direct Investing highlights for March 2026. See you next month.
[MUSIC PLAYING]
Transcript
[MUSIC PLAYING]
- The results are in. The TD Direct Investing Index cooled off in February, indicating less bullish sentiment among self-directed investors. Here are three key takeaways. First up, the TD Direct Investing Index, which measures sentiment in a range from negative 100, for very bearish, to plus 100, for very bullish, slipped to plus 8. That is down 7 points from January but up a whopping 24 points from a year ago.
Second sentiment. Sentiment for technology stocks was the lowest across all sectors in February, falling 4 points to minus 1. During the month, investors continued to rotate away from mega-cap US tech names, questioning whether AI will really deliver. Chipmakers NVIDIA, Micron Technology, and AMD were among the top sold stocks during the month.
And while sentiment dipped across all investor types, active traders-- that's 30 or more trades in the past three months-- stayed the most optimistic, coming in at plus 12, down 7 points from January. And for more information on the TD Direct Investing Index, head over to the URL on the screen. And that's your TD Direct Investing Index highlights for February 2026. See you next month.
[MUSIC PLAYING]
Transcript
[MUSIC PLAYING]
- The results are in, and the TD Direct Investing Index moved higher in January, indicating more bullish sentiment among self-directed investors. Here are three key takeaways. First up, the TD Direct Investing Index, which measures sentiment in a range from minus 100 for very bearish to plus 100 for very bullish, it came in at plus 15. That's up 11 points from December and an impressive 13 points higher than this time last year.
Second, sentiment for basic materials jumped 7 points to plus 11, occupying the top spot in January after sitting in second place for three straight months. Rising gold prices helped boost the basic materials sector and played a key role in pushing the S&P and TSX to fresh highs last month. Finally, Gen Z and millennials, those born in 1981 and after, were among the least optimistic groups, posting a score of plus 1. That's down one point from December.
Tech continued to dominate among the top bought stocks, including Microsoft, Nvidia, and Tesla, both of which were among the top bought by Gen Z and millennials throughout 2025. And for more information on the TD Direct Investing Index, please visit the URL visible on the screen. And that's your TD Direct Investing Index highlights for January 2026. See you next month.
[MUSIC PLAYING]
Transcript
The TD Direct Investing Index for the month of December has been released and self-directed investor sentiment turned positive last month. Here are the details.
Let's start with the overall TD Direct Investing Index, which measures sentiment in a range from -100 for very bearish to plus 100 for very bullish, and self-directed investor sentiment rebounded 16 points month-over-month to +4. That reverses three straight months of declining sentiment. When compared to December one year ago, very little changed when sentiment stood at plus three.
Right, taking a look at investor behavior scores, all core proxies ticked up a bit but chasing trends, which you can think of as a bit of FOMO, or fear of missing out, saw the biggest gains last month, jumping seven points to hit a neutral score of zero.
All right, here are a few key takeaways.
First, sentiment was highest in financial services last month.
Secondly, active traders, those with 30 or more trades in the past three months were the most optimistic.
And with respect to financial services, investor sentiment rose three points to plus eight.
Now, Canada's biggest banks reported their fiscal year-end with all six of the lenders posting higher Q4 profits that beat analysts' estimates. Heavily bought stocks, in financials, included : TD Bank, Royal Bank, and CIBC.
All right, when we slice things up by investor type, the divergence in sentiment between active traders and long-term investors, those have up to 29 trades in the past three months.
That divergence continued over the month. Active trader sentiment jumped six points to plus seventeen in December, putting them a whopping 21 points above the long-term investors' crowd.
And top-bought stocks that featured prominently for active traders included tech related names such as NVIDIA, Tesla, and Celestica. And for more info on TD Direct Investing Index, please see the following link to navigate to the TDDII page.
And that's your TD Direct Investing Index Highlights for December 2025.
Transcript
[MUSIC PLAYING]
- The TD Direct Investing Index for the month of November has been released, and self-directed investor sentiment turned bearish last month. Here are the details.
All right. Let's start with the overall TD Direct Investing Index, which measures sentiment in a range from minus 100 for very bearish to plus 100 for very bullish. And self-directed investor sentiment tumbled 10 points month over month to negative 12. This marks the lowest score since March when President Trump's Liberation Day tariffs shocked markets. It also ends a six month streak of bullish sentiment.
When we compare sentiment to November of last year, a big drop when sentiment stood at plus 33. All right. Taking a look at the investor behavior scores, most of the core proxies turned bearish in November. The Bought versus Sold proxy stood out, falling negative 10, down to 13 points month over month, reflecting increasing selling activity among self-directed investors.
Also Chasing Trends, which you can think of as a bit of FOMO, or Fear Of Missing Out, came in at negative 7, down 12 points month over month, indicating self-directed investors were chasing stocks in a falling market. A positive value would indicate investors bought more when share prices were rising.
All right. Here are a few key takeaways. First, sentiment for technology swung from the highest to the lowest sentiment across all sectors. Secondly, Gen Z and millennials, those born 1981 and after, were the most optimistic age group. So, not surprisingly, when we break things out by sector, self-directed investors were the most bearish on technology, which tumbled 19 points to negative 3.
Volatility returned to markets amid concerns about a bubble in AI stocks. Heavily sold stocks included NVIDIA, Celestica, and AMD. Looking at trading activity based on age, all cohorts saw sentiment fall during the month, but Gen Z and millennials emerged as the most optimistic group for the first time since April, with sentiment sip-- slipping, rather, just 3 points month over month to plus 1.
Top hot stocks that featured prominently for the youngest investors included NVIDIA, Tesla, and Canadian telecom giant Telus. And for more information on the TD Direct Investing Index, please see the following link to navigate to the TDII page. And that's your TD Direct Investing Index highlights for November 2025.
[MUSIC PLAYING]
Transcript
[MUSIC PLAYING]
- The TD Direct Investing Index for the month of October has been released, and self-directed investor sentiment became less bullish last month. Here are the details. Let's start with the overall TD Direct Investing Index, which measures sentiment in a range from minus 100 for very bearish to plus 100 for very bullish.
The self-directed investor sentiment fell in October to plus 22, an 11-point drop from the prior month. Now, this extended the streak of bullish sentiment to six straight months. When you compare sentiment to October of last year, a pretty big jump when market optimism stood at plus 9.
All right, taking a look at investor behavior scores last month, the flight-to-safety proxy dropped 7 points month over month to plus 2, meaning more self-directed investors traded in safer, less risky assets. Keep in mind, more positive value means risk on or less actual flight to safety.
All right. Here are a few key takeaways. First, active traders, those with 30 or more trades in the past three months, were more optimistic last month. Secondly, sentiment for Gen Z and millennials, those born in 1981 and after, slipped from bullish into neutral territory.
All right. When we break down the data by trading styles, we're seeing an interesting trend here. Active traders were the most optimistic for the fifth straight month at plus 25, up 2 points month over month. Meanwhile, long-term investors, those with up to 29 trades in the past three months, their sentiment pulled back 13 points to minus 3, marking the lowest sentiment since April, something we'll be keeping an eye on.
All right. Top bought stocks by active traders included chip leaders NVIDIA and AMD, along with global Bitcoin mining company Bitfarms. Now, when we break things out by age, sentiment among Gen Z and millennials edged down 2 points month over month to plus 4. And top-sold stocks for the youngest investors included Tesla, AMD, and amazon.com.
And for more information on the TD Direct Investing Index, please see the following link to navigate to the TD DII page. And that's your TD Direct Investing Index highlights for October 2025.
[MUSIC PLAYING]
Transcript
[AUDIO LOGO]
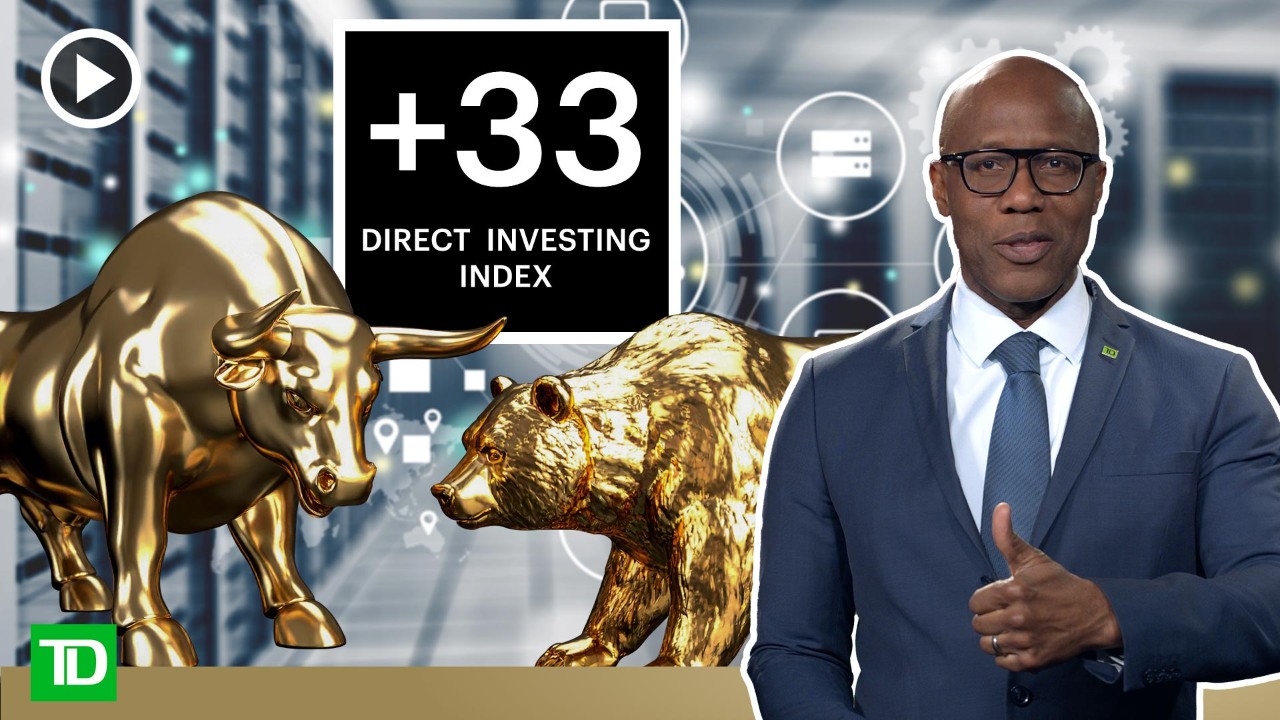
- The TD Direct Investing Index for the month of September has been released, and self-directed investor sentiment became more bullish last month. Here are the details. Let's start with the overall TD Direct Investing Index, which measures sentiment in a range from minus 100 for very bearish to plus 100 for very bullish. Self-directed investor sentiment rose in September to plus 33. That's a 13-point jump from the prior month, sustaining a five-month streak of optimistic investor confidence and falling just shy of July's peak.
The appetite for risk continued as markets moved higher across the board in what has historically been the worst month for stocks. When you compare sentiment to September of last year, a big jump when market optimism stood at plus 19.
Next, let's take a look at investor behavior scores, which make up the DII. And chasing trends, or trade direction, which measures whether people bought stocks on a rising or falling market really stood out. The proxy came in at plus 7 last month. That's up 7 points month over month, meaning investors were buying when share prices were rising, contributing positively to the overall DII score. Meanwhile, flight to safety rose 5 points month over month to plus 9, indicating more self-directed investors traded in higher-risk items, such as equities.
Here are a few key takeaways. First, Gen Z and Millennials, those born in 1981 and after, were still among the least optimistic age group. Secondly, materials had the top positive sentiment last month. Now, when we break things out by age, sentiment among the Gen Z and Millennials edged up 2 points month over month to plus 5 but still came up four points shy of the most optimistic age group, the Baby Boomers, those born between 1946 to 1964.
Top-bought stocks for the youngest investors included familiar activewear brand Lululemon, along with NVIDIA, amid a fresh AI frenzy, as well as global Bitcoin mining company Bitfarms. Meanwhile, materials captured the top spot as the most heavily traded sector, with sentiment climbing 3 points to plus 9 in September. This was supported by the continued strength in commodities, including gold and silver.
Heavily bought stocks within materials favored mining companies such as Teck Resources, Barrick Mining, and Kinross Gold. And for more information on the TD Direct Investing Index, please see the following link to navigate to the TD DII page. And that's your TD Direct Investing Index highlights for September 2025.
[AUDIO LOGO]
Transcript
The TD Direct Investing index for the month of August has been released.
And self-directed investor sentiment became less bullish last month.
Here are the details.
Let's start with the overall TD Direct Investing index, which measures sentiment in a range from -100 for very bearish to +100 for very bullish.
And self-directed investor sentiment pulled back in August to 20.
That's 11 points lower than in the prior month, but still well above August of last year when it stood at plus 1.
Now the latest DII score continued a trend seen over the past few months where retail investors exhibited positive sentiment despite continued uncertainty over U.S. trade policy.
Right next, let's take a look at investor behavior scores which make up the DII and chasing trends or trade direction, which measures whether people bought stocks on a rising or falling market really stood out.
The proxy was flat last month, falling 5 points month over month, meaning investors were buying when share prices were falling.
Contributing negatively to the overall DII score.
All right, here are a few key takeaways.
First, baby boomers, those born between 1946 to 1964, were the most optimistic for the fourth month in a row, and materials landed at the top spot as the most heavily traded sector.
Now, despite recording the biggest drop across all age groups in August, sentiment for boomers remained the highest at +6, just down 3 points month over month.
While a few tech names like Nvidia remained among the top bought stocks in August, dividend paying names like TD Bank and Canadian
Natural Resources climbed into the top bot last month.
Meanwhile, materials captured the top spot as the most heavily traded sector, with sentiment climbing 4 points to +6 in August amid the record breaking rise in the price of gold.
Materials unseated technology which had the lowest sentiment across all sectors.
Information technology underperformed the broader market in August amid concerns the AI fueled rally may be overdone.
Now, not surprisingly, heavily bought stocks within materials in August included Barrett Mining, Agnico Eagle Mines, and Kinross Gold.
And for more information on the TD Direct Investing index, please see the following link to navigate to the TDDII page.
And that's your TD Direct Investing index highlights for August 2025.
Transcript
[AUDIO LOGO]
- The TD Direct Investing Index for the month of July has been released, and self-directed investor sentiment became more bullish last month. Here are the key details. Let's start with the overall TD Direct Investing Index, which measures sentiment in a range from minus 100 for very bearish to plus 100 for very bullish.
And self-directed investor sentiment rose 5 points to plus 31 in July, notching the third straight month of market optimism. During the month, stock market indices climbed to new record highs after bouncing back from the postliberation day selloff. When you compare sentiment to July of last year, a big jump in market optimism stood at plus 8.
Next, let's take a look at the investor behavior scores, which make up the DII. And most core proxies saw minor pullbacks in July. However, one proxy really stood out. As bought versus sold, it jumped 9 points month over month to plus 9, indicating investors bought more than they sold last month as well as in July one year ago when the proxy came in at minus 1.
All right. Here are a few key takeaways. First, Baby Boomers, those born between 1946 to 1964, were the most optimistic among all age groups. And secondly, sentiment on technology was again the highest of all sectors. Baby Boomers, the generation closest to retirement, were the most optimistic for the third month in a row, with sentiment little changed at plus 9.
Now, interestingly, heavily bought stocks last month for Boomers, which included names such as Tesla, NVIDIA, and Shopify, resemble the shopping list across all age groups. And technology continued to benefit from investor optimism for the sector, with sentiment dipping just 1 point lower to plus 12 amid the ongoing boom in AI and strong company earnings. Heavily bought stocks included NVIDIA, Celestica, and AMD.
And for more information on the TD Direct Investing Index, please see the following link to navigate to the TD DII page. And that's your Direct Investing Index highlights for July 2025.
[MUSIC PLAYING]
Transcript
[MUSIC PLAYING]
- The TD Direct Investing Index for the month of June has been released and self-directed investor sentiment became less bullish last month. Here are the details.
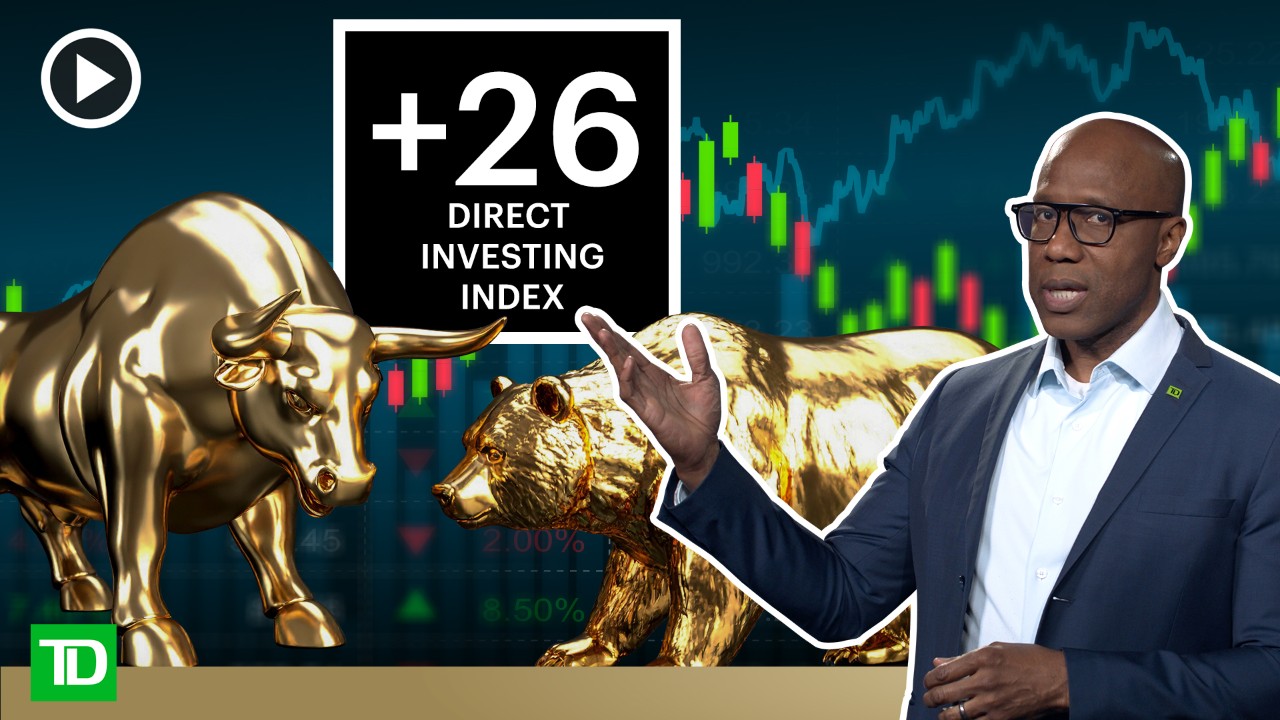
Let's start with the TD overall Direct Investing Index, which measures sentiment in a range from minus 100, for very bearish, to plus 100 for very bullish. And self-directed investor sentiment pulled back 10 points to a respectable plus 26 in June, just a month after market optimism peaked at its highest level in over two years. Now, at the halfway point of the year, stock markets have swiftly recovered to fresh highs as the worst of the tariff fears subsided. When you compare sentiment to June of last year, this is a big change when market optimism stood at negative 5.
Next, let's take a look at investor behavior scores which make up the DII. And there's more chasing stocks at 52-week highs or bought at extremes, which jumped 12 points to plus 11. But at the same time, the bought versus sold and flight to safety move from investors pulled the overall sentiment down.
A few key points that stood out-- first, active traders were the most optimistic after a big rebound in monthly sentiment. And secondly, sentiment on technology was the highest of all sectors. Now, although long-term investors, those with less than 30 trades over the past quarter, drove the overall sentiment index lower, the sentiment of active traders, those with over 30 trades in the past three months, jumped 7 points to plus 24 in June, just a few points shy of the overall DII score.
For active investors, heavily-bought stocks last month leaned towards tech-related names, including Tesla and chip giants NVIDIA and AMD. Now the sector that saw the greatest shift in investor sentiment was technology. That's up plus 7 points month over month to plus 13, underlying self-directed investors' increasing appetite for risk. Heavily-bought stocks included NVIDIA, AMD, and Applied Digital Corporation, mirroring somewhat the buying patterns of active traders and Gen Z and millennials, those born in 1981 and after.
And for more information on the TD Direct Investing Index, please see the following link to navigate to the TD DII page. And that's your TD Direct Investing Index highlights for June 2025.
[MUSIC PLAYING]
Transcript
[MUSIC PLAYING]
- The TD Direct Investing Index for the month of May has been released, and self-directed investor sentiment became bullish last month. Here are the details. Let's start with the overall TD Direct Investing Index, which measures sentiment in a range from minus 100 for very bearish to plus 100 for very bullish. And self-directed investor sentiment in May rocketed 43 points higher to plus 36, hitting its highest level of market optimism in more than two years.
The de-escalation of tariff concerns between the US and China was a major catalyst for the jump in May sentiment, putting in doubt the old adage, sell in May and go away strategy. When you compare sentiment to May of last year, this is a big change when market optimism stood at negative 4.
All right. Taking a look at the investor behavior scores, all the core proxies saw big gains in May. However two proxies really stood out. Flight to safety saw sentiment jump 16 points for a score of plus 14, indicating self-directed investors increased trading activity and lean more into riskier securities, such as equities.
Secondly, when we look at bought versus sold, the proxy soared to plus 12. That's up 10 points month over month, indicating investors bought more than they sold in May.
All right. A few key points that stood out. First, long-term investor sentiment rose more than active traders last month. Secondly, Baby Boomers, those born between 1946 to 1964, were the most optimistic age group last month.
Now, when we look at investor type, we're seeing an interesting shift here. Long-term investors, those with less than 30 trades in the past quarter, swung from negative to positive in May, as sentiment surged 30 points month over month to plus 19. Meanwhile, active traders, those with 30 or more trades in the last three months, they saw sentiment climb just 13 points month over month to plus 17. And it marked the first time in over two years that positive sentiment for long-term investors exceeded active traders. And for long-term investors, it's a mixed bag of heavily bought stocks last month, which included NVIDIA, Canadian energy giant Enbridge, and Royal Bank.
When we look at risk appetite across all ages, Baby Boomers were the most bullish last month, with sentiment rising 21 points to plus 14. Among the heavily bought stocks by Boomers were Tesla, Shopify, and Whitecap Resources. And for more information on the TD Direct Investing Index, please see the following link to navigate to the TDDII page. And that's your TD Direct Investing Index highlights for May 2025.
Transcript
[MUSIC PLAYING]
* The TD Direct Investing Index for the month of April has been released, and self-directed investor sentiment became less bearish last month. Here are the details. Let's start with the overall TD Direct Investing Index, which measures sentiment in a range from minus 100 for very bearish to plus 100 for very bullish.
* And self-directed investor sentiment in April soared 39 points to minus 7, bouncing back from its lowest level in more than a year, as the 90-day pause in US trade tariffs lifted market sentiment. When you compare sentiment to April of last year, there's been very little change, when market optimism stood at negative 8.
* Taking a look at the investor behavior scores, overall, most of the core proxies saw big improvement in sentiment in April. If we look at chasing trends or trade direction, again, this is where people are chasing stocks up or selling on the way down. And you can think of this as a bit of FOMO, or Fear Of Missing Out.
* In April, it was up plus 9, which was 16 points higher than what we saw in the prior month. When we look at bought versus sold, what we saw was a bullish indicator of plus 2. That's up 12 points month over month, indicating more self-directed investors bought than they sold during the month.
* A few key points that stood out. First, Gen Z and Millennials, those born in 1981 and after, were the most optimistic age group. And secondly, active trader sentiment bounced back from last month's negative score. So while risk appetite improved across all ages, investors with the longest time horizon before retirement were the most optimistic.
* Gen Z and Millennials were up 5 points to plus 3. And this younger demographic traded with a preference towards riskier investments last month, like technology. The most heavily bought stocks by Gen Z and Millennials in April included NVIDIA, Tesla, and amazon.com.
* If we take a look by investor type, the way we break it down is by the number of trades. And longterm investors have less than 30 trades over the past quarter, while active traders would trade 30 times or more in the past quarter. And what we're seeing here is an interesting dichotomy, and a lot of it is being driven by active traders.
* Sentiment in that group was plus 4. That's up 14 points month over month. Meanwhile, sentiment for longterm investors jumped 24 points higher in April to negative 11. It's a big improvement over the prior month, but still more pessimistic than active traders and the overall DII index.
* Now, among the heavily bought stocks by active traders were NVIDIA, Tesla, and Celestica. And for more information on the TD Direct Investing Index, you can visit the URL on the screen right now. That's your TD Direct Investing Index highlights for April 2025.
Transcript
[INSTRUMENTAL MUSIC PLAYING]
* The TD Direct Investing Index for the month of March has been released, and self-directed investor sentiment dropped further into bearish territory. Here are the details.
* Let's start with the overall TD Direct Investing Index, which measures sentiment from a range of minus 100 for very bearish to plus 100 for very bullish. And self-directed investor sentiment in March tumbled 30 points to minus 46, hitting its lowest level in more than a year as uncertainty over US trade policy unsettled markets.
* Now, the pullback in sentiment marked the second straight monthly decline in the DII score. When you compare sentiment to March of last year, the change in sentiment is even more pronounced, when market optimism stood at plus 17.
* Now, taking a look at the investor behavior scores, overall the core proxies were more bearish in March. The leading proxy was Chasing Trends, which came in at negative 7. That's down 13 points month over month, indicating self-directed investors bought more securities on a falling market last month. A positive value would indicate investors bought more when share prices were rising.
* When we look at bought at extremes, what we saw was a bearish indicator of negative 14. That's down 8 points month over month, indicating more self-directed investors were buying at the bottom of the market. If it's positive, self-directed investors would have bought at the top of the market, or a rolling 52-week high price.
* Now, a few key points that stood out. First, baby boomers, those born between 1946 to 1964, were the most pessimistic for the fourth month in a row. Meanwhile, active traders, those with more than 30 trades in the past three months, turned negative for the first time in over two years.
* Now, while there's less risk appetite across all ages, investors with the shortest time horizon before retirement were the most bearish. Boomers were down 6 points to minus 20, with sentiment down in most sectors you looked. Pessimism for technology, communications, and financial services stood out. The most heavily sold stocks by boomers last month included AI leader NVIDIA, EV maker Tesla, as well as Shopify.
* Now, when we break things out by investor type, active trader sentiment turned bearish for the first time since December 2022, dropping 17 points last month to minus 10. Now, historically active trader sentiment follows equity market momentum. When markets are down, they reduce risk. And this time was no different, as equity slumped under the weight of the trade concerns. Among the heavily sold stocks by active traders were NVIDIA, Tesla, and Celestica.
* And for more information on the TD Direct Investing Index, click on the following link to navigate to the DII page. And that's your TD Direct Investing Index highlights for March 2025.
[INSTRUMENTAL MUSIC PLAYING]
Transcript
THE TD DIRECT INVESTING INDEX FOR THE MONTH OF FEBRUARY HAS BEEN RELEASED, AND SELF-DIRECTED INVESTOR SENTIMENT DROPPED INTO BEARISH TERRITORY.
HERE ARE THE DETAILS.
LET'S START WITH THE OVERALL TD DIRECT INVESTING INDEX, WHICH MEASURES SENTIMENT IN A RANGE FROM -100 FOR VERY BEARISH TO +100 FOR VERY BULLISH.
SELF-DIRECTED INVESTOR SENTIMENT IN FEBRUARY TUMBLED 19 PTS TO MINUS 16, WHICH IS THE LOWEST DROP SINCE OCTOBER 2023, WHEN GEOPOLITICAL CONFLICTS RATTLED MARKETS AND SENT STOCKS TUMBLING. THE DII SCORE ALSO BROKE A STREAK OF SEVEN STRAIGHT MONTHS OF MARKET SENTIMENT HOVERING AT OR ABOVE NEUTRAL TERRITORY. WHEN YOU COMPARE THAT TO FEBRUARY OF LAST YEAR, THE CHANGE IN SENTIMENT IS EVEN MORE PRONOUNCED, WHEN MARKET OPTIMISM STOOD AT PLUS 9.
TAKING A LOOK AT INVESTOR BEHAVIOUR SCORES LAST MONTH…THE FLIGHT TO SAFETY PROXY SAW A BIG PULL BACK OF 11 PTS MOM TO MINUS 10, AMID A LACK OF VISIBILITY AND MARKET UNCERTAINTY SURROUNDING US TRADE POLICIES, LEADING INVESTORS TO ADOPT A RISK-OFF STANCE. KEEP IN MIND, A LOWER VALUE MEANS A SHIFT FROM RISKIER SECURITIES LIKE STOCKS INTO SAFER ASSETS SUCH AS MONEY MARKET FUNDS, TERM DEPOSITS AND CASH. MEANWHILE BOUGHT VS SOLD DROPPED 8 PTS TO MINUS 6, REFLECTING NEGATIVE SENTMENT FOR MARKETS.
A FEW KEY POINTS THAT STOOD OUT…
1. TECHNOLOGY EXPERIENCED THE MOST POSITIVE SENTIMENT FOR A SECOND STRAIGHT MONTH
2. LONG-TERM INVESTORS (UP TO 29 TRADES IN PAST 3 MO) TURNED MORE PESSIMISTIC
WHILE A DECLINE IN SECTOR SENTIMENT WAS SEEN ACROSS THE BOARD, OPTIMISM FOR TECHNOLOGY STOOD THE HIGHEST ONCE AGAIN, WITH SENTIMENT SITTING AT PLUS 2, DOWN 2 PTS MOM.
THE MOST HEAVILY BOUGHT STOCKS IN TECHNOLOGY LAST MONTH INCLUDED AI CHIP DARLING NVIDIA, SUPER MICRO COMPUTER, AND SHOPIFY.
THE DECLINE IN SENTIMENT LAST MONTH WAS VERY APPARENT AMONG LONG-TERM INVESTORS, WITH SENTIMENT TUMBLING 17 PTS TO MINUS 23. GIVEN THE RECENT NEGATIVE NEWS FLOW, IT'S APPARENT THAT LONG-TERM INVESTORS REACTED MORE STRONGLY TO EVENTS THAN DID ACTIVE TRADERS (30 OR MORE TRADES IN PAST 3 MO), WHERE SENTIMENT SLIPPED 2 PTS TO PLUS 7.
AMONG THE HEAVILY SOLD STOCKS BY LONG-TERM INVESTORS WERE NVIDIA, TESLA, AND ENBRIDGE.
AND THAT'S YOUR TD DIRECT INVESTING INDEX HIGHLIGHTS FOR FEBRUARY 2025.
Transcript
[MUSIC PLAYING]
- The TD Direct Investing Index for the month of January has been released, and self-directed investor sentiment remains stuck in neutral territory. Here are the details.
Let's start with the overall TD Direct Investing Index, which measures sentiment in a range from minus 100 for very bearish to plus 100 for very bullish. Overall, investors were neutral in January, with sentiment unchanged at plus 3, even as stock markets got off to a positive, albeit volatile start to the year. And when we compare sentiment to January of last year, we see a modest decline when optimism about markets stood at plus 9.
All right, take a look at investor behavior scores last month. Overall, it appeared that there was less buying stocks at the top of the market and a modest rotation away from safer, low-risk investments into higher risk assets. The flight to safety proxy edged higher, 4 points, month over month to plus 1. Now, keep in mind a more positive value means risk on or less actual flight to safety. Meanwhile, bought at extremes or buying securities at 52-week highs fell 8 points to minus 1, reflecting a negative sentiment.
All right, a few key points that stood out. Number one, technology experienced the most positive sentiment in January. Secondly, traditionalists, those born between 1928 to 1945, were the most optimistic across all age groups.
Now, despite the emergence of Chinese DeepSeek, a low-cost Chinese artificial intelligence model, self-directed investors were optimistic on the tech sector in January. Sentiment for the sector climbed to plus 4, up 5 points month over month.
Taking a look at the most heavily bought stocks in January, they included Nvidia, even as the AI chip leader suffered double-digit declines following a late selloff in the month. Now, the steep drop was sparked by concerns over increased competition from AI startup DeepSeek. Other heavily bought stocks included MicroStrategy and AMD.
Meanwhile, traditionalists, the oldest generation, swung from bearish to bullish last month, with sentiment rising 9 points to plus 6. Not surprisingly, heavily bought stocks by traditionalists as well as all other age groups in January included AI darling Nvidia, as well as Enbridge and BCE. Two stocks known for their comparably higher yield dividends were also heavily bought by traditionalists last month.
And that's your TD Direct Investing Index highlights for January 2025.
[MUSIC PLAYING]
Transcript
[MUSIC PLAYING]
- The TD Direct Investing Index for the month of December has been released, and self-directed investor sentiment fell from bullish into neutral territory. Here are the details. Let's start with the overall TD Direct Investing Index, which measures sentiment in a range from minus 100 for very bearish to plus 100 for very bullish.
Overall, investors were mostly neutral in December with sentiment dropping to plus 3. That's the lowest level in four months. It's also substantially worse than in November, when DII was at plus 33 after the Trump-related bounce sparked a massive stock market rally. Now, it's also down from December one year ago when sentiment stood at plus 12.
Taking a look at investor behavior scores, we did see more selling than buying activity last month, which helped lower bullish sentiment. The bought versus sold measure tumbled 10 points month over month to negative 6. At the same time, the flight to safety move from investors also pulled the overall sentiment down from bullish into neutral territory. Flight to safety, or risk appetite, was negative 3, down 12 points month over month, indicating less risk on last month.
Now, a few key points that stood out. First, for the second straight month, consumer discretionary saw the biggest gain in sentiment. Also, sentiment for long-term investors, those with up to 29 trades in the previous three months swung from bullish to bearish territory last month. Now, despite stocks closing out a strong year on a weak note, self-directed investor sentiment in consumer discretionary sector improved. Investor sentiment on the sector climbed to plus 18, up 7 points month over month.
The most heavily bought stocks in December, once again, included Amazon, Dollarama, and Tesla. Now, shares of the EV maker hit record highs in December on optimism the company will benefit from ties to President-elect Donald Trump. Meanwhile, long-term investors saw sentiment tumble from plus 9 to negative 15, marking a 24-point U-turn month over month.
Meanwhile, active traders-- those with 30 trades or more in the past three months-- remain more bullish than long-term investors despite a pullback in equity markets last month. Active trader sentiment slipped to plus 18, down 6 points. Heavily-sold stocks by long-term retail investors last month included Tesla, Air Canada, and BCE. Now, some analysts have suggested the Canadian telecom giant may need to cut its rich dividend to help strengthen its balance sheet. And that's your TD Direct Investing highlights for December 2024.
Transcript
[MUSIC PLAYING]
- The TD Direct Investing Index for the month of November has been released, and self-directed investor sentiment soared into bullish territory. Here are the details.
We'll start with the overall TD Direct Investing Index, which measures sentiment in a range from negative 100 for very bearish to plus 100 for very bullish. In November, sentiment jumped to plus 33. That's a hefty 24-point gain over the previous month, as US election euphoria over Donald Trump's victory ignited a market rally.
US equities capped off their biggest monthly gains this year as investors bet Donald Trump's proposed tax cuts and deregulation would boost corporate profits. The final DI score was marginally higher compared to November sentiment one year ago, when it stood at plus 31.
By taking a look at investor behavior scores, all the components that make up the DII were mostly bullish. We'll start with chasing trends, which measured how many investors bought stocks on a rising or falling market.
And last month, saw sentiment jump 7 points for a score of plus 15, indicating more investors bought as share prices rose. Also, the bought versus sold measure rose 9 points month over month to plus 4. Now, keep in mind, if this measure is positive, it means that self-directed investors bought more than they sold.
All right, a few key points that stood out last month. We'll start with consumer discretionary, which saw the biggest gain in sentiment in November. Also, active traders, those with 30 trades or more in the past three months, were mostly bullish last month. Again, consumer discretionary came out as the most heavily traded sector with a sentiment score of plus 11 in November. That's an 11-point jump as self-directed investors leaned into Trump Trade 2.0.
The most heavily bought stocks in November included Amazon, Dollarama, and Tesla. Now, shares of the EV maker was a big beneficiary of the Trump bump after its CEO, Elon Musk, supported Donald Trump's bid to return to the White House. Meanwhile, active traders with sentiment up 8 points to plus 24 were the most optimistic than long-term investors.
However, both investor types made significant jumps in sentiment. Long-term investors, those with fewer than 30 trades in the past three months, saw sentiment surge to plus 9. That's up 18 points from the previous month. Heavily bought stocks by active traders and long-term investors last month included Tesla, AI chip leader, NVIDIA, as well as MicroStrategy, which became the world's biggest corporate holder of Bitcoin.
Now, the software company saw its stock soar amid expectations of President-elect will oversee a crypto-friendly administration. And that's your TD Direct Investing Index highlights for November 2024.
[MUSIC PLAYING]
Transcript
[UPBEAT MUSIC]
- The TD Direct Investing Index for the month of October has been released. And self-directed investor sentiment dropped lower but still clung onto bullish territory. Here are the details.
Let's start with the overall TD Direct Investing Index, which measures sentiment in a range from minus 100 for very bearish to plus 100 for very bullish. In October, we saw an increase in political uncertainty ahead of the US elections. And investors took notice, with the DII sentiment falling to plus 9. That's down 10 points from the prior month.
Market volatility has historically increased in the lead-up to elections, as investors weigh possible outcomes. And this cycle was no exception. Comparing DII sentiment to October of last year, we saw a big increase when sentiment stood at negative 39.
Taking a look at investor behavior scores, the components that make up the DII were lower but remained in bullish territory in October. However, we did see a bit more selling than buying activity, which was a drag on overall sentiment.
Net equity demand, or bought versus sold, came in at negative 5. That's down six points month over month, indicating self-directed investors sold more securities than they bought in October.
A few key points that stood out. First, technology saw the biggest gain in sentiment in October. Second, overall sentiment in Canada was the lowest in the province of Ontario.
Now, within technology, sentiment for the sector rose to plus 13 for a month-over-month gain of eight points, despite waning enthusiasm for technology stocks. Self-directed investors, particularly active traders, those with over 30 trades in the past three months, favored AI chip leader NVIDIA, rival chip maker AMD, and software giant Microsoft, which ranked among the most heavily bought stocks in October.
When we slice this and look at it by province, sentiment in Ontario dropped seven points, from 8 to plus 1 last month. Ontario investors were the most bearish on financial sector, along with communications and consumer cyclicals, when compared to other provinces. Heavily sold stocks by Ontario investors last month included Tesla, NVIDIA, and the scandal-plagued Super Micro Computer, the once high-flying AI server company.
And that's your TD Direct Investing highlights for October 2024.
[UPBEAT MUSIC]
Transcript
[MUSIC PLAYING]
* The TD Direct Investing Index for the month of September has been released, and self-directed investor sentiment bounced back into bullish territory. Here are the details. Let's start with the overall TD Direct Investing Index, which measures sentiment in a range from minus 100 for very bearish to plus 100 for very bullish. And DII sentiment landed at plus 19. That's up 18 points from August, despite a rough start to what is historically the weakest month for the stock market.
* Equities capped off a strong month as investors reacted to the Fed's surprise jumbo-sized rate cut and growing optimism that the economy is headed for a soft landing. The final score was significantly higher compared to September sentiment one year ago, where the DII was stuck at negative 31.
* Taking a look at investor behavior scores, overall, the core proxies were more bullish in September. The leading proxy was chasing trends, which came in at plus 12. That's up 10 points month over month, indicating that self-directed investors bought more securities on a rising market last month. A negative value would indicate investors bought more when share prices were decreasing.
* When we look at flight to safety or risk appetite, what we saw was a bullish indicator of plus 3. That's up 3 points month over month, indicating more self-directed traders were trading in high-risk items such as equities.
* A few key points that stood out. First, financials saw the biggest gain in sentiment and were the most heavily traded sector in September. Secondly, while all age groups showed improved sentiment, Generation X, born between 1965 to 1980, showed the greatest improvement.
* Now, a key driver for financials where sentiment jumped 7 points month over month to plus 8 has been a series of rate cuts from the Bank of Canada which have helped reignite interest in the sector. The rate relief could bolster borrowers' credit worthiness, as well as give banks some breathing room amid the imminent threat of the mortgage renewal cliff. TD bank, Bank of Nova Scotia, and Bank of Montreal ranked within the most heavily traded companies.
* Meanwhile, sentiment for Gen X jumped 8 points month over month to plus six in September, notching the biggest gains among all age groups. Heavily bought stocks during the month included AI chip giant NVIDIA and Tesla. But the age cohort also favored traditional dividend paying names such as TD Bank and BCE, which rounded out the most heavily traded companies.
* And that's your TD Direct Investing Index highlights for September 2024.
[MUSIC PLAYING]
Transcript
[MUSIC PLAYING]
- The TD Direct Investing Index for the month of August has been released, and self-directed investor sentiment was stuck in neutral. Here are the details. Let's start with the overall TD Direct Investing Index, which measures sentiment in a range from minus 100 for very bearish to plus 100 for very bullish.
DII sentiment landed at plus 1. That's down seven points from July as stock markets were hit with a meaningful bout of volatility in August amid worries about US recession and the implications of a sharply strengthening Japanese yen. However, markets were quick to recover thanks to renewed expectations for federal reserve rate cuts and a soft landing for the US economy.
When we compare sentiment to August of last year, a huge gain when sentiment was at negative 23. Taking a look at the investor behavior scores, one core proxy helped us understand why positive sentiment edged into neutral territory in August. Flight to safety dropped seven points to zero, meaning more self-directed investors traded in lower risk items such as cash, bonds, fixed income, and money markets.
Now, a few key points that stood out. First, energy came out on top as the most heavily traded sectors in August. Secondly, traditionalists born between 1928 to 1945 were, again, the most optimistic. Energy sentiment led confidence in all sectors in August, with a score of plus 3, inching up one point month-over-month as self-directed investors look toward dividend paying stocks for stability and income.
The most heavily bought energy stocks last month included Enbridge, a favorite among investors for its steady dividend payouts. Self-directed investors also bought shares of Cenovus Energy and Canadian natural resources. Meanwhile, sentiment for traditionalists remained the highest, despite slipping one point to plus 1 in August.
Traditionalists didn't show much of a change in their sector sentiment last month. Being more conservative with a focus on wealth preservation, the old [AUDIO OUT] gravitated towards traditional dividend paying stocks. The top bought securities last month included big banks TD and Bank of Montreal.
Meanwhile, telecom giant BCE, which boasts a dividend yield of more than 8% was also among the top bought in August. Along with dividends, some of the other factors that may have influenced their decisions were comfort with an investment, buying what you know, to home bias, buy where you live. And that's the TD Direct Investing Index highlights for August 2024.
Transcript
[MUSIC PLAYING]
- The TD Direct Investing Index for the month of July has been released, and self-directed investor sentiment turned bullish. Here are the details. Let's start with the overall TD Direct Investing Index, the DII. That measures sentiment in a range from negative 100 for very bearish to plus 100 for very bullish. DII sentiment landed at plus 8 for July. It's a 13-point gain over the previous month. The summertime rally kept its momentum going even as leadership flipped from those mega-cap tech titans to lower-priceed small-cap and value stocks that slipped under the radar in 2024. When we compare sentiment to July of last year, a modest gain when sentiment was at plus 1.
Taking a look at the components that make up the DII, we saw improvement in the flight to safety measure, which rose 11 points to plus 7. That means more investors traded in higher-risk items such as equities. A negative value means risk off or more flight into safer, less risky investments. However, fewer self-directed investors bought equities at the top of the market. The proxy for chasing stocks at 52-week highs was only plus 1 in July, down 7 points month over month. Investors rotated out of high-flying technology and communication stocks into value-oriented sectors such as financials and basic materials that offered more attractive valuations.
A few key points that stood out. Financial services ranked as the most heavily traded sector in July. Secondly, traditionalists, those born between 1928 and 1945, were the most optimistic. Financials which previously sat near the bottom in June bounced back to be the top traded sector in July with a sentiment score of plus 5. That is up 6 points month over month. Meanwhile, the technology sector slipped to the near bottom, slumping 16 points to minus 1 in July as those large-cap tech stocks sold off during the month.
Among the heavily sold stocks in technology were Shopify and chip giants NVIDIA and AMD as enthusiasm for AI related stocks waned. Meanwhile, sentiment for traditionalists climbed 7 points month over month to plus 2 in July. Not surprisingly, the eldest generation favored dividend-paying stocks such as BMO, TD, and BCE, which were among the top-bought stocks last month.
And that's your TD Direct Investing Index highlights for July 20th, 24.
[MUSIC PLAYING]
Transcript
[MUSIC PLAYING]
- The TD Direct Investing Index for the month of June has been released and self-directed investor sentiment remained in neutral. Here are the details. Let's start with the overall TD Direct Investing Index, which measures sentiment in a range from minus 100 for very bearish to plus 100 for very bullish.
And DII sentiment settled at negative 5 for June, down a mere point from the prior month. The so-called June swoon for stocks failed to materialize as improving inflation data, and the continued AI theme helped stock markets gain ground last month and for the first half of 2024. When we compare sentiment to June of last year, a big drop when sentiment was at plus 19.
Looking at the components that make up the DII, two core proxies helped us better understand why sentiment slipped marginally in June. One was net equity demand, or bought versus sold. It came in at negative 9. That's down 3 points month over month, indicating self-directed investors sold more securities last month. A positive value would indicate investors bought more than they sold.
Secondly, flight to safety or risk appetite from investors, as you can see, was minus 4. That's four points lower than last month, meaning more investors pulled back into safer, less risky investments. A more positive value means risk on or less actual flight to safety. Now, a few key points that stood out.
Number one, technology was the big winner for a second month in a row. And secondly, Gen Z and millennials, born 1981 and after, were once again the most optimistic age group, although they remained in neutral territory. Technology remained the most heavily traded sector, with a sentiment score of plus 14. That's up 7 points month over month.
The rank of heavily bought stocks and technology were little changed in June, with chip giants AMD, Super Micro Computer, and AI torchbearer NVIDIA-- which briefly took the top spot as the world's most valuable company by Market Cap-- occupied the top spots. Meanwhile, sentiment for Gen Z and millennials edged up two points month over month to plus 4 in June. Heavily bought stocks by the youngest investors included tech giants NVIDIA, Apple and Tesla.
And that's your TD Direct Investing highlights for June 2024.
[MUSIC PLAYING]
Transcript
[MUSIC PLAYING]
- The TD Direct Investing Index for the month of May has been released, and self-directed investor sentiment improved modestly to neutral. Here are the details. Let's start with the overall TD Direct Investing Index, which measures sentiment in a range from minus 100 for very bearish to plus 100 for very bullish.
And DII sentiment landed at negative 4 for May indicating a neutral stance. That's a gain of 4 points from April. A strong first-quarter earnings results helped ease investors' fears about inflation and a potentially delayed Federal Reserve pivot to interest-rate cuts. When we compare sentiment to May of last year, it was a big gain when sentiment was at minus 18.
Now, looking at the components that make up the DII, we saw a slight improvement in the chasing-trends measure, which rose 2 points to plus 2, indicating more investors were buying on a rising market. Now, a few key points that stood out. First, technology was the most heavily traded sector in May. Secondly, investor sentiment across all age groups were mostly neutral about markets last month, but Gen Z and Millennials born 1981 and after, were the most optimistic.
As I mentioned, technology came out on top as the most heavily traded sector with a sentiment score of plus 7, up 5 points month over month. The AI-fueled rally in chipmakers came to a peak on May 24 when the NVIDIA forecasted stronger-than-expected revenue growth, thanks to surging demand for its AI chips.
Among the heavily bought stocks in technology were chip Giants NVIDIA, AMD, and Supermicro Computer. Meanwhile, sentiment for Gen Z and millennials slipped 1.2 plus 2 in May.
Heavily bought stocks by the youngest investors included NVIDIA, which announced a 10 for 1 stock split that helps make its shares more affordable to smaller investors. Other heavily bought names included popular meme stock, AMC, and GameStop. And that's your TD Direct Investing highlights for May 2024.
[MUSIC PLAYING]
Transcript
[MUSIC PLAYING]
- The TD Direct Investing Index for the month of April has been released, and self-directed investor sentiment turned bearish for the first time in six months. Here are the details. Let's start with the overall TD Direct Investing index, which measures sentiment in a range from minus 100 for very bearish to plus 100 for very bullish.
Well, after a solid start in 2024, April showers rained down on investors' parade, testing their resilience. DII investor sentiment landed at negative 8 for April, a big loss of 26 points compared to March, breaking the streak of five straight months of bullish sentiment. Stocks ended the worst month of the year, as stubbornly sticky inflation data doused market hopes for interest rate cuts by summer.
When we compare sentiment to April of last year, there was little change when sentiment stood at minus 11. When we look at components that make up the DII, all the proxies were down across the board in April. Significantly, however, flight to safety or risk appetite from investors, as you can see, was minus 6, 6 points lower than last month, meaning more investors pulled back into safer, less risky investments. A more positive value means risk on or less actual flight to safety.
We also saw a drop in chasing trends measured-- minus 4 points to 0, indicating more investors were buying on a falling market. A few key points that stood out-- Energy saw the most trading activity in April, followed by basic materials, the next most popular sector. Secondly, investors felt more negative about the markets last month, but Baby Boomers born between 1946 to 1964 were the most pessimistic.
As I mentioned, energy came out on top as the most heavily traded sector, with a sentiment score of plus 6, up 2 points month over month. The surge in oil prices this year, driven in part by escalating tensions in the Middle East, has also helped prop up energy stocks Among the heavily bought stocks in energy were Crescent Point Energy, Baytex Energy and Enbridge, which boasts a strong record of dividend payments and an attractive yield.
Meanwhile, sentiment for Boomers slumped 11 points, month over month, to minus 8 in April, reversing the previous month's gain that saw sentiment rebound back into bullish territory. Heavily sold stocks by Boomers included tech giants Nvidia, Tesla, and Shopify. And that's your TD Direct Investing Index highlights for April 2024.
[MUSIC PLAYING]
Transcript
* The TD Direct Investing Index for the month of March has been released, and the self-directed investors continued their bullish sentiment. Here are the details.
* Let's start with the overall TD Direct Investing Index, which measures sentiment in a range from minus 100 for very bearish to plus 100 for very bullish. And it came in at plus 17, a gain of 8 points from last month, and marked the fifth straight month of bullish sentiment.
* Last quarter, news of a resilient economy, strong corporate earnings, excitement about the AI revolution, and expectations for rate cuts, helped markets get off to a soaring start in 2024. The gains in March helped the S&P 500 Index notch its best first quarter performance since 2019. When we compare sentiment to March of last year, it was a big gain, when sentiment was at minus 20.
* Now, when we look at components that make up the DII, one proxy helped capture why sentiment rose in March. Chasing Trends, which measures how many investors bought stocks on a rising or falling market, soared 9 points month over month to plus 12, indicating more investors bought as share prices rose.
* Now, a few key points that stood out. Technology remained the most heavily traded sector in March, climbing 2 points month over month, to plus 15, while communications ranked the worst after dropping 4 points to minus 3.
* Secondly, all age groups were optimistic about markets last month, with baby boomers-- those born between 1946 to 1964-- seeing the biggest jump in sentiment. Not surprisingly, NVIDIA was among the most heavily bought stocks in the IT sector, fueled by explosive earnings growth from its gold standard chips for AI.
* Other heavily bought stocks included chip maker AMD and Super Micro Computer. Within communications, concerns over debt, increasing competition, and higher bond yields, saw interest rate-sensitive sectors such as telecoms, real estate, and utilities sell off.
* BCE and Telus were among the most heavily sold stocks, along with tech giant Alphabet. The Google parent is one of the so-called Magnificent Seven stocks, including Apple and Tesla, that have seen their performance falter recently.
* Meanwhile, sentiment for boomers rebounded 8 points month over month, to plus 3 in March, and joined all other age groups in feeling optimistic about the markets.
* Across all ages, heavily bought stocks included NVIDIA, Tesla, AMD, Super Micro Computer, and Canadian telecom giant BCE, which boasted a dividend yield of nearly 9%.
* And that's your TD Direct Investing Index highlights for March 2024.
* [MUSIC PLAYING]
Transcript
* The TD Direct Investing Index for the month of February has been released, and self-directed investors remain bullish once again. Here are the details.
Let's start with the overall TD Direct Investing Index, which measures sentiment in a range from minus 100 for very bearish to plus 100 for very bullish. And it came in unchanged at plus 9 as investor sentiment recorded a fourth straight month in bullish territory.
* February, historically a flat month for stocks, saw the NASDAQ and S&P 500 indices notch their best February in nearly a decade despite a clouded inflation picture and reduced bets for rate cuts. When we compare sentiment to February of last year, it was a big gain, when sentiment was at minus 8.
* When we look at the components that make up the DII, overall, while most of the core proxies were down slightly in February, the drop was offset by an improvement in the bought versus sold measure, which rose three points month-over-month to minus 2. Keep in mind if the measure is negative, it means self-directed investors bought less than they sold. A less negative measure last month implied the gap between securities sold versus bought narrowed.
* A few key points that stood out. It was deja vu as technology ranked as the most heavily traded sector in February, slipping five points month-over-month to plus 13. Secondly, Gen Z and Millennials, born 1981 and after, were more optimistic, while Baby Boomers, born between 1946 to 1964, were the only age group in the bearish camp.
* Within the IT sector, the AI poster child NVIDIA was one of the heavily bought stocks last month. The chip maker surpassed Amazon and Alphabet by market cap during the month following blockbuster earnings. Rounding out heavily bought stocks in the IT sector were Advanced Micro Devices, Super Micro Computer, and cryptocurrency miner Marathon Digital Holdings. A rally in Bitcoin saw the cryptocurrency soar to its highest level in more than two years.
* Meanwhile, sentiment for Gen Z and Millennials rose two points month-over-month to plus 4, while Boomers were the most bearish at minus 5, down two points in February. Among the most heavily bought stocks by the youngest generation were tech-oriented companies Tesla and Shopify as well as chip maker NVIDIA. NVIDIA was widely held by all age groups last month, bringing new life to the FOMO AI trade.
And that's your TD Direct Investing Index highlights for February 2024.
[MUSIC PLAYING]
Transcript
[MUSIC PLAYING]
* The TD Direct Investing Index for the month of January has been released. And the main story was that self-directed investors stayed modestly bullish one month into 2024. And here are the details.
* First, let's start with the overall TD Direct Investing Index, which measures sentiment in a range from minus 100 for very bearish to plus 100 for very bullish. And it landed at plus 9, a slight 3-point drop month over month. Investor sentiment clung to the bullish camp in January, often seen as a barometer for the market. In other words, with the market ending January on a high note, it's considered a positive sign for the remainder of the year and vice versa.
* And while the overall DII score declined modestly in January, sentiment remained bullish for a third month in a row and was 3 points higher versus January 1 year ago. And when we look at the components that make up the DII, one proxy helped us better understand why sentiment slipped in January. Chasing trends, which measures how many investors bought stocks on a rising or falling market, it tumbled 11 points month over month to plus 5, indicating fewer investors bought as share prices rose.
* Now a few key points that stood out. First, similar to last month, technology was again the big winner in January with sentiment rising 5 points month over month to plus 18. And secondly, active traders, those who are 30 or more trades over the past three months, were more optimistic than long-term investors, those with 29 trades or less over the last three months.
* And developments in artificial intelligence and optimism over the technology's ability to generate big profits well into the future have been a tailwind for the IT sector. The most heavily bought stocks-- tech stocks last month included chip giant NVIDIA, which gained 40% in US dollar terms in January following a monumental rise in 2023. Other heavily bought stocks included AMD, Shopify, and Microsoft, which eclipsed Apple to become the world's largest company by market capitalization.
* Now, when we look at trading activity based on investor type, active traders were the most positive with sentiment at plus 20 after edging down 5 points month over month. And tech stocks proved to be popular in January for active traders, led by Tesla, NVIDIA, and Shopify. And that's your TD Direct Investing Index highlights for January 2024.
[MUSIC PLAYING]
Transcript
[MUSIC PLAYING]
- The TD Direct Investing Index for the month of December has been released. And the big takeaway was that self-directed investors remain bullish for a second straight month. Here are the details.
First, let's start with the overall TD Direct Investing Index, which measures sentiment in a range from minus 100 for very bearish to plus 100 for very bullish. And it came in at plus 12. That's down 20 points month over month.
Now, the stock market rally that started in November shifted into overdrive in December after the Federal Reserve opened the door to US interest rate cuts in 2024. Now, while sentiment was less bullish month over month, it was up a massive 78 points compared to last December when sentiment was at minus 66.
Now, when we look at components that make up the DII, two core proxies help us understand why positive sentiment slipped in December. First, the proxy for net equity demand, or bought versus sold, it came in at negative 14. That's down 14 points month over month, indicating self-directed investors sold more securities last month. A positive value would indicate investors bought more than they sold.
Another bearish indicator was flight to safety. And the measure came in at plus 1, falling 9 points month over month, indicating more investors pulled back into safer, less risky investments. Keep in mind, a lower value means risk off or more actual flight to safety.
Now, a few key points that stood out. First, technology came out on top once again as the most heavily traded sector, boosted by sustained interest from active traders, those with 30 or more trades in the past three months. Secondly, baby boomers born between 1946 to 1964 were the least optimistic age group last month.
Again, leading the way was the tech sector, sitting at plus 13 in December versus plus 15 the prior month. The most heavily bought tech stocks last month included chip giant NVIDIA, along with cryptocurrency miners Bitfarms, Hut 8, and Marathon Digital Holdings. Now, crypto stocks rallied in December on hopes that US regulators may loosen up rules around the types of cryptocurrency ETFs.
Now, when we look at trading activity based on age, baby boomers were the least positive with sentiment falling 11 points to negative 2. And boomers spread their most sold securities in December across banks, like CIBC, and tech-related names, such as NVIDIA, Tesla, and Shopify.
And that's your TD Direct Investing Index highlights for December 2023.
[MUSIC PLAYING]
Transcript
Bullish, bearish, or somewhere in between?
Introducing the new TD Direct Investing Index.
Information made easy; insights made effortless.
Get a monthly sentiment score to see how self-directed investor behavior trended.
"Hello everyone, I'm Kim Parlee and this is a look at the TD Direct Investing Index."
Browse the stocks that were bought…sold…and held onto the most.
See where others invested their money …by filtering for the information that matters to you.
And if you want more, learn more,
…through daily, live online workshops and videos.
Wonder how other self- directed investors felt about the market?
Find out…with the new TD Direct Investing Index.
Transcript
Speaker 1 [00:00:04] The TD Direct Investing Index, or DII, is a snapshot of what happened with self directed investors in one month. More specifically, it looks at monthly activity of self directed investors on TD's web broker. For example, last month it showed us what these investors were doing to which we can extrapolate how they were feeling... bullish, bearish or relatively neutral. The index has a range from -100 being the most bearish to plus one hundred being the most bullish. But the DII itself is made up of four separate measures and each one of those can be bullish or bearish. So let's take a look. The first measure looks at the bought/sold imbalance, which was a net activity of equities that were bought or sold. The second measure looks at chasing trends, which shows what was bought on the way up and what was bought on the way down. Third, we look at equities bought at extremes, which measures what was bought at 52 week highs and what was bought at 52 week lows. And the fourth measure is flight to safety, also known as risk on risk off. And that means people looking at moving into safer investments, things like cash, GICs and fixed income. The overall DII can also be applied to different groups and different sectors. For example, it looks at which sectors investors felt most bullish or bearish about. It also looks at sentiment by type of investors, those who trade frequently to those who tend to buy and hold and also by age to see which age groups are feeling more bullish and bearish. Finally, every month it will show which securities were most bought and sold in that month. And that's a quick look at what makes up the TD Direct Investing Index.
Transcript
[MUSIC PLAYING]
* The TD Direct Investing Index for the month of November has been released, and the big takeaway was that self-directed investors turned bullish, breaking a three-month streak of negative sentiment. Here are the details.
* First, let's start with the overall TD Direct Investing Index, which measures sentiment in a range from minus 100 for very bearish, to plus 100 for very bullish, and it came in at positive 31, thanks to a solid 70-point gain month over month.
* Stock markets rallied in November as signs of easing inflation lifted hopes central banks may be done raising interest rates, and that cuts may be coming sooner than previously expected. And investors took notice, with sentiment up a whopping 54 points, versus November of last year when sentiment was minus 23.
* And when we look at the components which make up the DII, overall the core proxies were more bullish in November. The leading proxy was chasing trends, which came in at plus 16. That's up 21 points month over month, indicating self-directed investors bought more securities on a rising market last month. A negative value would indicate investors bought more when share prices were decreasing.
* Another bullish indicator was flight to safety, and the measure came in at plus 10. That was up 19 points month over month, denoting bullish sentiment. Now, keep in mind a more negative value means risk off or more actual flight to safety.
* A few key points stood out. First, overall sentiment was up in every sector you looked. But technology came out on top as the most heavily traded sector, lifted by increased interest from boomers, born between 1946 to 1964, and Gen X, born between 1965 to 1980. Secondly, all age groups were bullish in November, however, baby boomers showed the biggest improvement in sentiment.
* Now, sectors most sensitive to borrowing costs led the way, including IT, which rose 13 points month over month to plus 15. This was followed by consumer discretionary and financials at plus 6 and plus 5 respectively. The most heavily bought tech stocks last month included Microsoft and chip giants NVIDIA and AMD.
* When we look at trading activity based on age, baby boomers were the most positive, with sentiment jumping 30 points to plus 9. And boomers were split on picks. The most bought securities in November included NVIDIA, Tesla, Bank of Nova Scotia, and energy giant Enbridge.
* And that's your TD Direct Investment Index highlights for November 2023.
[MUSIC PLAYING]
Transcript
[MUSIC PLAYING]
- The TD Direct Investing Index for the month of October has been released, and the big takeaway was that self-directed investor sentiment was bearish for the third month in a row. Here are the details.
Let's start with the overall TD Direct Investing Index, which measures sentiment in a range from negative 100 for very bearish to plus 100 for very bullish. And it came in at negative 39. That's down 8 points from last month and slightly more bearish from October one year ago when sentiment was negative 26.
When you look at the components which make up the DII, overall, the core proxies were all bearish again and mostly down month over month. Significantly, we saw fewer self-directed investors buying at the top of the market. The proxy for buying at extremes or chasing stocks at 52-week highs was the lowest at negative 17. That's down 10 points month over month, which helped us to get to more bearish.
A few key points that stood out-- first, financials remain the most negative sector for the third straight month, while technology emerged as the only positive sector. Secondly, most age groups were feeling negative about markets, but Gen Z and millennials-- those born in 1981 and after-- were by far the most optimistic bunch. Sentiment for financials tumbled 9 points in October to negative 12.
A notable steepening in bond yields during the month continued to put further downward pressure on dividend paying equities like banks. Meanwhile, the tech sector saw sentiment improve 4 points to plus 2. The most heavily sold financial stocks last month included Bank of Nova Scotia, Royal Bank, TD, and CIBC.
When you look at trending activity based on age, Gen Z and Millennials were the most positive with sentiment edging up to plus 1. The most bought securities by Gen Z and millennials last month included Tesla, TD Bank, Air Canada, and energy giant Enbridge. And that's your TD Direct Investing Index highlights for October 2023.
[MUSIC PLAYING]
Transcript
[MUSIC PLAYING]
The TD Direct Investing Index for the month of September has been released. And the key takeaway is that self-directed investor sentiment remained in bearish territory for the second straight month. Here are the details. First, we'll take a look at the overall TD Direct Investment Index, which measures sentiment from a range of minus 100 for very bearish to plus 100 for very bullish. And it came in at negative 31 in September, a decline of 8 points month over month but a big improvement from September one year ago, when sentiment was a very bearish minus 56. And when we look at the components which make up the DII, overall, the core proxies were quite bearish and mostly down month over month. And like the prior month, chasing trends or investors who bought stocks in a rising market was the most negative proxy at minus 11 in September after a modest 2-point month-over-month drop. A few key points that stood out-- sentiment across all sectors ranged from neutral to slightly bearish in September, seasonally the worst month for markets. But financials still placed among the lowest in overall sentiment. Secondly, baby boomers born between 1946 to 1964 were even more pessimistic in September. When we break things out by sector, self-directed investor sentiment for financials edged up 3 points in September but remains slightly negative at minus 3. The ramp higher in bond yields during the month put downward pressure on dividend-paying equities, like banks. Meanwhile, the tech space suffered the biggest drop in sentiment, falling 6 points month over month to minus 2, a slight shift into bearish territory. The artificial-intelligence hype appeared to cool in September after sizzling in the first half of this year. The most heavily sold stocks in financials last month included Bank of Nova Scotia, TD Bank, CIBC, and Bank of Montreal. Among the most heavily sold names in the IT sector were NVIDIA, the world's leading maker of chips tailored for artificial intelligence, as well as Advanced Micro Devices and Microsoft. And, finally, when we look at trading activity based on age, baby boomers were, once again, the most pessimistic group in September with overall sentiment falling to minus 20. And that's your TD Direct Investing Index for September 2023.
[MUSIC PLAYING]
To determine the monthly sentiment of self-directed investors, we analyze these criteria for the last month:
1 Bought vs. Sold: Measures net equity demand—whether investors were buying more or selling more in a specified month.
2 Chasing Trends: Measures if investors were buying on a rising or on a falling market.
3 Bought at Extremes: Measures if investors were buying at either the top or bottom (dip) of the market.
4 Flight to Safety: Measures how much investors were pulling back into safer, less risky investments.
Transcript
[INSTRUMENTAL MUSIC PLAYING]
* The TD Direct Investing Index for the month of March has been released, and self-directed investor sentiment dropped further into bearish territory. Here are the details.
* Let's start with the overall TD Direct Investing Index, which measures sentiment from a range of minus 100 for very bearish to plus 100 for very bullish. And self-directed investor sentiment in March tumbled 30 points to minus 46, hitting its lowest level in more than a year as uncertainty over US trade policy unsettled markets.
* Now, the pullback in sentiment marked the second straight monthly decline in the DII score. When you compare sentiment to March of last year, the change in sentiment is even more pronounced, when market optimism stood at plus 17.
* Now, taking a look at the investor behavior scores, overall the core proxies were more bearish in March. The leading proxy was Chasing Trends, which came in at negative 7. That's down 13 points month over month, indicating self-directed investors bought more securities on a falling market last month. A positive value would indicate investors bought more when share prices were rising.
* When we look at bought at extremes, what we saw was a bearish indicator of negative 14. That's down 8 points month over month, indicating more self-directed investors were buying at the bottom of the market. If it's positive, self-directed investors would have bought at the top of the market, or a rolling 52-week high price.
* Now, a few key points that stood out. First, baby boomers, those born between 1946 to 1964, were the most pessimistic for the fourth month in a row. Meanwhile, active traders, those with more than 30 trades in the past three months, turned negative for the first time in over two years.
* Now, while there's less risk appetite across all ages, investors with the shortest time horizon before retirement were the most bearish. Boomers were down 6 points to minus 20, with sentiment down in most sectors you looked. Pessimism for technology, communications, and financial services stood out. The most heavily sold stocks by boomers last month included AI leader NVIDIA, EV maker Tesla, as well as Shopify.
* Now, when we break things out by investor type, active trader sentiment turned bearish for the first time since December 2022, dropping 17 points last month to minus 10. Now, historically active trader sentiment follows equity market momentum. When markets are down, they reduce risk. And this time was no different, as equity slumped under the weight of the trade concerns. Among the heavily sold stocks by active traders were NVIDIA, Tesla, and Celestica.
* And for more information on the TD Direct Investing Index, click on the following link to navigate to the DII page. And that's your TD Direct Investing Index highlights for March 2025.
[INSTRUMENTAL MUSIC PLAYING]
The TD Direct Investing Index (DII) is designed to be an educational tool that seeks to measure the attitude and behaviour of self-directed investors in the prior month—and present it in a format that is easy to read and understand.
The DII devises how investor sentiment has been trending: Are investors optimistic or pessimistic about recent market conditions?
Monthly sentiment is measured by examining four distinct investor behaviours from the previous month. Were investors:
- Buying or selling more?
- Buying more on a rising market?
- Buying more at the top of the market or during a dip?
- Retreating to less risky investments?
The result of each measure is compiled and averaged to quantify investor sentiment on a scale from very bullish to very bearish—and anywhere in between.
See a detailed description of the terms used in the DII
See our report Understanding Investor Behaviour
In April 2022 we began a three-month transition of the DII methodology. During this period we slowly adjusted the proxy logic and data modelling to improve the quality of our analysis. This transition was completed for the July 2022 data, at which time we also adjusted the monthly data to include the full calendar month. Accordingly, comparisons between periods with different methodologies may not be as accurate as comparisons between periods of the same methodology.
Understanding Investor Behaviour
TD Bank Group
September 2021
"Pay less attention to what (people) say. Just watch what they do."
Dale Carnegie
An Introduction
The actual investment decisions of individuals may be the most honest representation of investor feelings and beliefs. By looking at self-directed investor trading activity, we can see how people react to economic and financial market events. From this we can aim to uncover sentiment patterns of self-directed investors.
TD Direct Investing is in a unique position to help further the understanding of Canadian self-directed investor behaviour. As a market share leader in the Canadian market (number of clients and number of trades0), our data available is the richest of any Canadian self-directed brokerage firm.
In this paper, we present the TD Direct Investing Index (DII), statistics and analysis which harnesses this data. The DII is based on aggregated and de-identified trades placed by TD Direct Investing self-directed investing clients, with reference to contemporaneous market data. The result is an index of self-directed investor sentiment (optimism/pessimism) over a particular historical timeframe. We also present a literature review on sentiment indices, compare our index to other sentiment indices, and detail our methodology for determining the index component proxies.
The data within the DII that was used to create the index can also be segmented to observe the activity of self-directed investors by different age cohorts and even geographic regions. By performing these analyses, we reveal the investing behaviour of self-directed investors to so that they can make the most informed investment decisions for themselves. At the end of this paper, we share an example of how we use the rich dataset to present initial findings that contribute to the literature on investor diversification by demonstrating regional bias of Canadians based on their home province or territory.
Assessing Existing Research on Sentiment
Following the pioneering research by Baker and Wurgler (2006) and referring to the study in Delong, Shleifer, Summers, and Waldmann (1990), investor sentiment is an emotional state of an individual investor. This emotion is tied to the investor's expectation about the future return of their investment assets. As this is a non-physical, intangible psychological state, it is incredibly difficult to measure sentiment directly. An alternative to the challenge of directly measuring the emotions of investors is to define proxies which can infer sentiment. The simplest way of doing this is to survey investors. Unfortunately, this is an imperfect method as investors may articulate one sentiment at the time of surveying but may act very differently when they actually come to invest. Therefore, researchers and behavioral economists alike approach survey results cautiously (Baker and Wurgler 2007). In contrast to using the self-reported survey responses to gauge sentiment, we use aggregated trading activity of self-directed investors to reveal sentiment.
Comparison of the DII and Other Models
Nearly all the sentiment indices found in the literature (presented above) focus on abstracted market-level information as opposed to the actual transactions of an investor analyzed in aggregate. Rarely is it seen that a study focuses on the actual trading behaviour of the investors to probe elements of behaviour and sentiment. The most probable reason behind this is that analyzing investor actions and behaviour requires a highly granular data with records for every transaction (e.g. buy/sell) the investor has conducted. Such data is likely difficult to come by. In cases where transaction data are available, the set of traded securities are different in nature from one study to another (i.e. some studies focus on a specific securities market such as warrants). What's more, published studies focus on aggregate trades and do not make the distinction between trades by individual self-directed investor and institutional investors (e.g. pension funds, insurance companies, etc.). Crucially, the TD Direct Investing platform is utilized by an investor population composed of only self-directed investors and no institutional investors1 , and therefore can better represent the behaviour and sentiment of self-directed investors. We are uniquely able to leverage both granular transaction records of self-directed investors and market data to help address the limitations in prior work that focus on aggregate market metrics, specific security markets, and institutional investors.
Finally, it is noted that there is a lack of consensus—in terms of definitions, assumptions, methodologies and results—in the literature describing stock market dynamics. In part, we attribute this disagreement to the breadth and complexity of stock market parameters, for which researchers do not have complete ability to interrogate. All of this makes it difficult to come to a coherent and somewhat universal conclusion about the necessary components of investor sentiment. In other words, there is no clear consensus on how to determine sentiment—either qualitatively or otherwise.
Despite differences, it is possible to generalize principles of investor sentiment to the self-directed portfolio, even if the trader population and dynamics are not perfectly aligned with those in other studies. A fundamental assumption shared by most researchers is that all investors have the common goal of maximizing their return (regardless of the degree of rationality of their actions). Another assumption that we believe would be fair to make is that the amount and quality of information available to the self-directed investor comparable across markets, though it may be utilized differently by investors.
Review of Other Measures of Sentiment
There are three main approaches to measuring investor sentiment. The first approach is survey-based. An example of such an approach includes the American Association of Individual Investors (AAII) Investor Sentiment Survey, which is a weekly poll of its members' opinion of the stock market over the next 6 months. The drawback of such approach, as mentioned above, is that investors' response may not align with how they will act.
The second approach measures sentiment either based on market variables such as stock prices, trading volume (i.e., number of shares), etc., or based on granular (intraday) investor transaction records. Perhaps the most widely referred study in the market variable-based approach is that of Baker and Wurgler (2006, 2007). In this study, several market variables are proposed in constructing the sentiment:
- Trading volume, or liquidity, increases when investor sentiment is optimistic
- Dividend premium is inversely related to sentiment
- Closed-end fund discount increases when investors sentiment is low
- Initial Public Offering (IPO) first day returns often earn remarkable returns that is in part fueled by investor sentiment. When investor sentiment is high, people tend to buy-up and create demand for IPOs, pushing up prices.
- IPO volume is very sensitive to investor sentiment
- Equity issues over total issues is a broader measure of equity financing activity that reflects a firm shifting between equity and debt and often relate to positive investor sentiment
The authors apply a principal component analysis (PCA, see glossary) on the proxies, which have previously been regressed against key macroeconomic factors to remove business cycle effects. The resulting first component is treated as the composite index for sentiment. Note that, some proxies in the above reveal the sentiment in a delayed manner. As such, for these proxies, their lagged values have been considered.
In another study that leverages market variables, Meier (2018) suggests utilizing stock price data to measure overconfidence in the stock market. Meier argues that confidence has two components: strength and weight. The former measures the extremeness of the available evidence (recent performance versus performance in a benchmark period) while the latter measures the actual credibility of the evidence (are the gains because of good market conditions or rather due to investor's skills?). Here, evidence is simply the difference in past gains. Meier follows the argument of Griffin and Tversky (1992) that investors attribute their recent gains to their own skill rather than other factors (good market conditions or luck) and therefore characterizes overconfidence by high strength and low weight. In another study, Lemmon and Portniaguina (2006) suggest that investor confidence can be measured by considering the variation of small stock prices. This is particularly true for non-institutional investors (i.e., self-directed investorself-directed investors) as they tend to favor small stocks to large ones.
In Burghardt's thesis published 2010, the author leverages self-directed investorself-directed investors option transaction data in the European Warrant Exchange at Börse Stuttgart to build a sentiment index. Four activities, namely: buy-call, sell-call, buy-put and sell-put of options are used to measure the sentiment (see glossary). Naturally, buy-call and sell-put contributes positively to the sentiment while sell-call and buy-put negatively. The author also shows that the proposed transaction-based metric has a high correlation with respected market sentiment indices as well as market returns. This metric is also referred to as the options trajectory.
In a separate study that utilizes self-directed investor transaction data, Kumar and Lee (2006) propose a sentiment index for self-directed investors based on the Buy Sell Imbalance (BSI) metric. This metric first calculates the disparity between buy and sell volumes for each stock on a daily basis. The buy-sell imbalance of each stock is then normalized (see glossary) by stock's volume of transaction. Finally, the normalized imbalance for each stock is aggregated to give the buy-sell imbalance of the whole market. Since the buy-sell imbalance for each stock is normalized by the total buy/sell volume prior to aggregation, the overall metric it not sensitive to the potential bias introduced by large moves from wealthy investors. This metric is sometimes referred to as the Net Equity Demand (NED) or simply the demand-shift, interchangeably.
The third approach measures sentiment based on unconventional, and often unstructured data such as textual data from social media, or factors such as seasonality (Kamstra, Kramer and Levi 2003), sporting events (Edmans, Garcia and Norli 2007) or the occurrence of major events in the news (Li et al. 2014). Perhaps one of the most famous such indices is the BUZZ NextGen AI US Sentiment Leaders Index which scrapes the Web to identify the most mentioned stocks (by taking into account the network influence ranking of the users talking about the stocks), scans social media to check what is said about these identified stocks and then uses natural language processing in order to determine whether the sentiment expressed on these stocks is positive, negative or neutral.
The DII adopts the market-based approach where we consolidate the self-directed investor aggregated trading activity with market variables and leverage the combined data to construct a sentiment index. Compared to the studies surveyed so far, our approach captures the sentiment of a sample of Canadian self-directed investors rather than that of the overall market, which would include both self-directed and institutional investors.
Selecting Proxies for the DII
We utilize anonymous, security-specific transactions to build proxies for self-directed investors from different segments such as age group, geographical region and trading style. We aggregate the proxies to build a sentiment index that reflects the sentiment of Canadian self-directed investors by different demographics. In the construction of the DII, we employ a series of procedures to select the relevant proxies, from which the sentiment index is composed.
In the first step, we filter out proxies that are biased to a particular segment of self-directed investors. Specifically, we ensure that the selected proxies reflect the sentiment of the long-term, average self-directed investor. In this preliminary stage, we also consider the availability of the data required to construct the proxies.
In the second step of the procedure, we employed a proprietary statistical process which utilizes dimensionality reduction techniques (PCA) to further reduce the proxy space
In the final step, we use a qualitative approach where we use expert judgement and effective challenge with subject matter experts to assess and validate the rationale for including various proxies in the sentiment index.
Following the three steps, we reduced the pool of candidate proxies2 down to the four final proxies:
- Bought vs. Sold:
Measures net equity demand—whether self-directed investors were buying more or selling more in a specified month. If positive, they bought more than they sold. If negative, they bought less than they sold. - Flight to Safety:
Measures how much self-directed investors were pulling back into safer, less risky investments. If negative, self-directed investors traded in lower risk items such as cash, bonds, fixed income, and Money Markets. If positive, self-directed investors traded in higher risk items such as equities. - Bought at Extremes:
Measures if self-directed investors were buying at either the top or bottom of the market. If positive, self-directed investors placed trades on a rolling 52-week high price. If negative, self-directed investors placed trades in a market dip. (A rolling 52-week high or low means the highest and lowest price the security traded at during a one-year period back from today. The lowest price is often referred to as a market dip.) - Chasing Trends:
Measures if self-directed investors bought securities on a rising or declining market. If positive, it indicates self-directed investors placed trades on increasing share prices. If negative, DI investors placed trades on decreasing share prices.
Once the set of proxies is determined, we construct the sentiment index by combining the proxies.
Performance of the Sentiment Model
As mentioned previously, investor sentiment is an abstract concept that is difficult to quantify. Therefore, there are multiple approaches to evaluate the validity of the sentiment index. One common way is to compare the sentiment index to a broad benchmark index that represents the market and reflects its sentiment (e.g. bearishness or bullishness) in aggregate. Even if the market is composed of both institutional and self-directed investors, it is expected that some relationship exists between the market return and the sentiment of self-directed investors. This is important because if sentiment doesn't move with the equity markets, the effectiveness of the sentiment index is lessened. Because we think there is a relationship, we conduct the following tests as evidence.
The resulting index can be seen in Figure 1. This is the raw outcome of the model, where positive (negative) values mean bullish (bearish). For benchmark index, we have chosen the S&P/TSX Composite Index. This is a popular index of Canadian publicly traded securities. We can see that over the time period analyzed in our graph, our DII aligns with the TSX - our index is bullish while the TSX is bullish.
Figure 1: TD DII Compared to the TSX Index
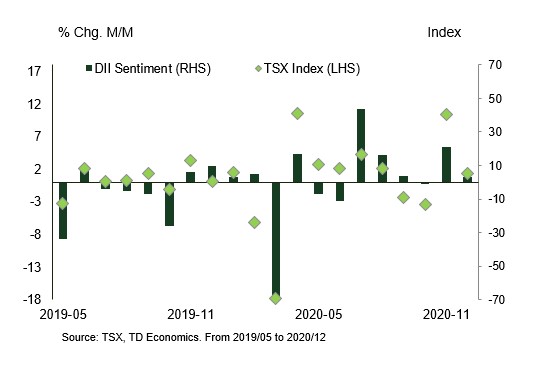
In developing the DII, we noted there is a tremendous wealth of research on the relationship between sentiment indices and stock market returns (Brown and Cliff, 2004; Smales, 2017; Bathia et al., 2013). From this, we test using a Vector Autoregression (VAR, glossary), whether the lag of our sentiment index impacts the TSX (or vice versa). Here we show the impulse response of the two variables on each other. We also use an Ordinary Least Squares (OLS, glossary) method for the contemporaneous impact, where the TSX can influence sentiment within the same month (rather than with a lag).
Below are the impulse response functions of the VAR estimates. The resulting impulse response shows statistical significance of the TSX’s influence on self-directed investor sentiment but does not show a significant impact of self-directed investor sentiment on the TSX. Given the scale of self-directed investors relative to that of institutional investors, we would not expect a strong response of the market to the impulse of self-directed investors' sentiment. In other words, this data suggests that self-directed investors tend to react to the market, but rarely drive the market.
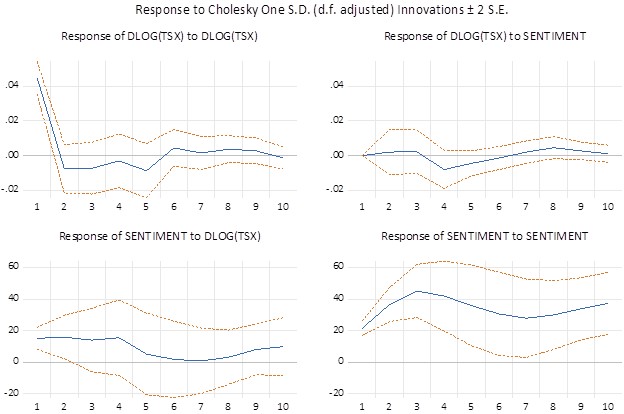
The above charts show the impulse response of the TSX Index and DII Sentiment (if one variable moves, how much of an impact does it have on other variables). Top left, the impact of the TSX on itself (if the TSX goes up this month, what are the chances it goes up next month). Top right, the impact of the TSX to DII Sentiment (if the TSX goes up this month, what are the chances DII sentiment goes up next month). Bottom left, the impact of DII Sentiment from the TSX. Bottom right, the impact of DII Sentiment on itself. Readings above (below) zero show a positive (negative) relationship of one variable on another.
Given impact of the TSX on the DII sentiment, as demonstrated by the VAR estimation, we further this analysis by conducting an ordinary least squares estimation (glossary). The independent variables, lagging sentiment and a contemporaneous TSX (same time), are regressed against the monthly sentiment score. Here we find statistical significance: the monthly sentiment score is explained by its lagging score and the concurrent month's market performance.
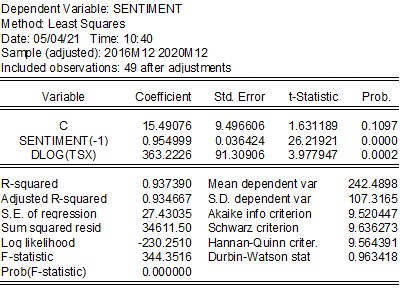
See glossary for definitions.
Taken together, these tests indicate that each month's sentiment is influenced by its historical score as well as past and present market performance. This is consistent with our expectation that a relationship should exist between the monthly sentiment and the concurrent month's market performance; however, the relationship is not always exact given the fact that institutional investors are usually the market movers.
In addition to the sentiment-TSX interdependency validation test, we have also assessed the stability of the model over time (each month we look at the output of the model to make sure it is logical). The stability of the model is important as a degraded model can no longer represent the current sentiment accurately. The results of the stability test suggest that the model performance when trained on the entire dataset is very much aligned with the performance of the model when trained on a fraction of the data (on an ongoing basis). A model monitoring plan is also in place to ensure that in the future, we can identify any model drift in order to recalibrate the model in a timely manner.
Additional Insights from DII3
As outlined at the onset of this paper, one of our key objectives was to understand the degree of diversification within self-directed investor portfolios, and whether bias influences investment decisions. The data within the DII that was used to create the index can also be segmented to observe the activity of self-directed investors by different age cohorts and even geographic regions. Access to this information goes to the spirit of the creation of the DII, as an educational tool where we share insights with self-directed investors so that they can make the most informed investment decisions for themselves.
For the period of December 2020, we use the transactional records of self-directed investors and perform additional analysis to derive insights of self-directed investor behaviour, providing additional context to interpreting the DII.
Activity By Age Group
In Canada, there was an interesting divergence between age categories for certain sectors. In Table 1 we see that Financial stocks were clear favorites for all self-directed investor groups, but we find that the allocation to that sector increased with age. Though we cannot determine the exact cause this, we do know that Financials provide greater dividends than other sectors, and income streams can be an important factor for Canadians in older age categories. Additionally, Financial corporations typically have been in operation for a long time, and the comfort with such storied companies may impact investor preference.
Technology was second highest allocation for Canadians younger than 35 and those 35-to-50. This compares to Energy being the second most popular sector for Canadians 51 years of age and older. This divide may be a result of younger self-directed investors openness to new companies, versus older self-directed investors comfort with historically successful companies.
Table 1: Top Two Portfolio Sector Weights by Age Cohort (December 2020)
| Age | Sector Allocation | |||
| Highest | Second Highest | |||
| Sector | % | Sector | % | |
| Less than 35 | Financials | 25.7 | Technology | 15.7 |
| 35 to 50 | Financials | 27.5 | Technology | 13.9 |
| 50 to 65 | Financials | 30.1 | Energy | 13.5 |
| Over 65 | Financials | 34.8 | Energy | 12.9 |
Sector Allocation by Geography
We can also breakdown the sector allocation by geographic region. Here we found significant geographical differences across provinces and territories. In Figure 2 and Table 2, we show the sectors with the largest differences between regional allocations. In Figure 4, we highlight the provinces of Alberta, Ontario, Saskatchewan, Nova Scotia, Quebec, and British Columbia for descriptive purposes. Table 2 shows the complete dataset as of December 2020.
Figure 2: Sector Allocation by Province
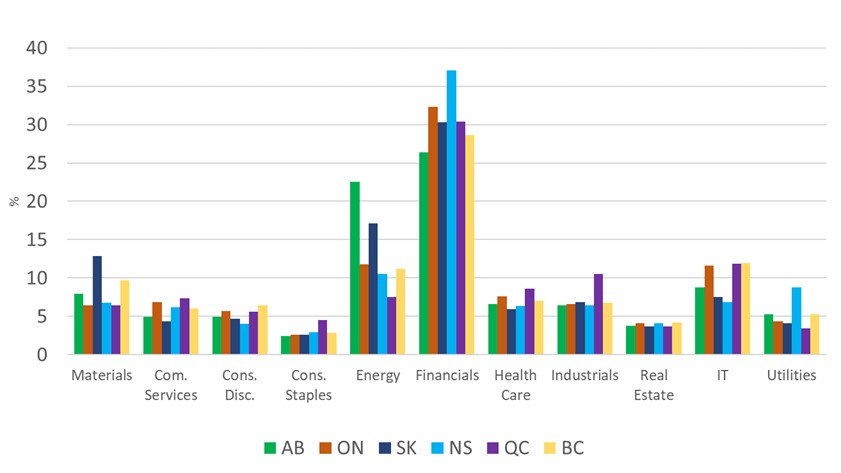
Table 2: Detailed Sector Allocation by Province
| Mat. | Com. Serv. | Cons. Disc. | Cons. Stpl. | En. | Fin. | Heal. Care | Ind. | Real Estate | Tech. | Utilities | |
| TSX | 12.2 | 4.7 | 4.0 | 3.5 | 12.0 | 30.9 | 1.6 | 12.3 | 3.2 | 10.9 | 4.8 |
| AB | 7.9 | 4.9 | 4.9 | 2.4 | 22.5 | 26.4 | 6.6 | 6.4 | 3.8 | 8.7 | 5.3 |
| NTU | 14.8 | 5.4 | 3.9 | 3.9 | 12.6 | 26.5 | 8.0 | 9.0 | 3.5 | 6.0 | 6.4 |
| ON | 6.5 | 6.8 | 5.7 | 2.6 | 11.7 | 32.3 | 7.6 | 6.6 | 4.1 | 11.6 | 4.4 |
| NL | 11.2 | 5.3 | 4.5 | 2.9 | 11.0 | 27.2 | 6.8 | 5.4 | 4.6 | 9.7 | 11.4 |
| NB | 8.9 | 7.7 | 4.7 | 2.7 | 10.8 | 33.3 | 8.1 | 7.4 | 3.6 | 7.4 | 5.5 |
| SK | 12.9 | 4.4 | 4.6 | 2.6 | 17.1 | 30.3 | 5.9 | 6.8 | 3.7 | 7.5 | 4.1 |
| NS | 6.7 | 6.2 | 4.0 | 2.9 | 10.5 | 37.0 | 6.4 | 6.4 | 4.1 | 6.9 | 8.8 |
| PE | 5.8 | 7.0 | 3.9 | 3.4 | 10. | 33.5 | 7.3 | 6.7 | 3.9 | 8.9 | 9.0 |
| YT | 11.5 | 6.9 | 4.7 | 2.4 | 11.1 | 30.1 | 6.4 | 8.4 | 3.8 | 9.2 | 5.4 |
| QC | 6.4 | 7.3 | 5.6 | 4.5 | 7.5 | 30.4 | 8.6 | 10.5 | 3.7 | 11.9 | 3.4 |
| BC | 9.7 | 6.0 | 6.4 | 2.9 | 11.2 | 28.7 | 7.0 | 6.8 | 4.2 | 11.9 | 5.2 |
| MB | 7.6 | 6.3 | 5.5 | 3.5 | 10.6 | 34.2 | 7.0 | 8.1 | 4.3 | 8.9 | 4.1 |
Data are in percent, as of December 2020.
For the Materials sector, we note that self-directed investors across the Territories and Saskatchewan had much greater exposure than self-directed investors in other locations. Materials companies can include those related to metals (such as gold, copper, and iron ore) and non-metals (such as potash and diamonds).
For Energy, investors in Alberta, Saskatchewan, and the Territories were most exposed. Energy companies largely include those related to oil and gas.
For Financials, we saw that self-directed investors in the Maritimes and Ontario had the most exposure. These include companies such as banks and insurance companies.
This regional breakdown revealed a potential home preference/bias. It may suggest that investors from geographic locations where employment and economic production are dependent on a specific sector tend to have an overweight of equity exposure to that sector as well. This is best exemplified by the Energy sector. Here we saw that self-directed investors who live in the geographic areas with the most economic exposure to Energy were also most overweight Energy in their portfolios.
Concluding Thoughts
In this paper we use the aggregated and anonymous trading data of TD Direct Investing self-directed investing clients to help build a measure of investor sentiment. This index helps determine how self-directed investors were feeling about equity markets over historical period.
We have also presented details of the dataset to help improve our clients understanding of risk-taking and investor bias. This has direct ties to help our clients be aware of the benefits of portfolio diversification. Here we show how investment exposure to certain higher risk sectors was influenced by age. We also show that self-directed investors may have a home bias by overweighting sectors that are economically more prominent in the province or territory in which they live. The evidence of age impacting risk-taking and geographic home bias is important in our understanding of self-directed investor behaviour.
Glossary
Normalization: In statistics and its applications, normalization refers to a process whereby values are adjusted to allow for meaningful cross-comparisons. Normalization may be implemented to bring different measures to a notionally common scale to prior to averaging.
Ordinary least squares estimation: This is a statistical technique used to understand the relationship between a dependent variable and one or more independent variables. The coefficient tells us the estimated magnitude of effect of the independent variable on the dependent variable, as well as the directionality (e.g., increase or decrease) of that relationship. On the other hand, standard error tells us the precision in which the coefficient is measured. If a coefficient is large compared to its standard error, then it implies that there is some relationship between the independent and dependent variable.
Principal component analysis: This is a statistical technique used to reduce the dimensionality of data while preserving as much information as possible of the original dataset. This is achieved by creating new variables, or principal components, that contains information of the original variables and maximizes the information or variance.
Proxies: In the DII context, proxies are investing behaviour measures based on trade activity that allow us to make inferences about investor sentiment.
Put options: A put option gives the owner the right to sell an underlying security at a specific price until a certain date. When selling a put option (sell-put), the seller agrees to buy a stock at an agreed-upon price. It's also known as shorting a put. The seller is anticipating that the stock price will rise in value.
Buy-call: a bullish trade that gives the buyer the choice to exercise the option, allowing them to buy the underlying security at the strike price
Sell-call: a bearish trade that if exercised by the buyer, forces them to sell the underlying security at the strike price
Buy-put: a bearish trade that gives the buyer the choice to exercise the option, allowing them to sell the underlying security at the strike price
Vector autoregression estimation: This is a statistical technique used to capture the relationship between multiple quantities as they change over time. This technique is useful for understanding how a variable is a function of past lags of itself and past lags of the other variables.
References
Baker and Wurgler (2006): Investor Sentiment and the Cross-Section of Stock Returns
Delong, Shleifer, Summers, and Waldmann (1990): Noise Trader Risk in Financial Markets
Baker and Wurgler (2007): Investor Sentiment in the Stock Market
Meier (2018): Aggregate Investor Confidence in the Stock Market
Griffin and Tversky (1992): The Weighing of Evidence and the Determinants of Confidence
Lemmon and Portniaguina (2006): Consumer Confidence and Asset Prices: Some Empirical Evidence
Kamstra, Kramer and Levi (2003): Winter Blues: A SAD Stock Market Cycle
Edmans, Garcia and Norli (2007): Sports Sentiment and Stock Returns
Li et al (2014): The Effect of News and Public Mood on Stock Movements
Huang et al (2015): Investor Sentiment Aligned: A Powerful Predictor of Stock Returns
Balcilar et al (2017): Predicting Stock Returns and Volatility with Investor Sentiment Indices: A Reconsideration Using a Nonparametric Causality-in-Quantiles Test
Matthias Burghardt (2010): Retail Investor Sentiment and Behavior – an Empirical Analysis
Kumar and Lee (2006): Retail Investor Sentiment and Return Comovements
Brown and Cliff (2004): Investor Sentiment and the Near-Term Stock Market
Smales (2017): The Importance of Fear: Investor Sentiment and Stock Market Returns
Bathia, Deven, and Don Bredin (2013): An Examination of Investor Sentiment Effect on G7 Stock Market Returns
Disclaimer
The information contained herein has been provided by TD Direct Investing and is for information purposes only. The information has been drawn from sources believed to be reliable. Graphs and charts are used for illustrative purposes only and do not reflect future values or future performance of any investment. The information does not provide financial, legal, tax or investment advice. Particular investment, tax, or trading strategies should be evaluated relative to each individual's objectives and risk tolerance.
The TD Direct Investing Index (DII) provides data and insights relating to historical self-directed investor activity. The DII is for informational purposes only. Any information provided through the DII should not be considered an investment recommendation, nor is it an offer, or solicitation of an offer to purchase or sell any investment fund, security or other product. Particular investment, trading, or tax strategies should be evaluated relative to each individual’s objectives. Investors should not take the historical information as an indication, assurance, estimate or forecast of future values or future performance. The DII should not be used as individual financial, legal, investment or tax advice. Please consult your own legal, investment and/or tax advisor. Information provided through the DII is subject to change without notice.
In April 2022 we began a three-month transition of the DII methodology. During this period we slowly adjusted the proxy logic and data modelling to improve the quality of our analysis. This transition was completed for the July 2022 data, at which time we also adjusted the monthly data to include the full calendar month. Accordingly, comparisons between periods with different methodologies may not be as accurate as comparisons between periods of the same methodology.
The Toronto-Dominion Bank and/or its subsidiaries or affiliated persons or companies may hold a position in the securities mentioned, including options, futures and other derivative instruments thereon, and may, as principal or agent, buy or sell such securities. They may also make a market in, issue, and participate in an underwriting of such securities.
A high degree of risk may be involved in the purchase and sale of options and may not be suitable for every investor. The risk of loss in trading securities, options and futures can be substantial. Investors must consider all relevant risk factors, including their own financial situation before trading. A higher level of market knowledge, risk tolerance and net worth is required.
TD Bank Group means The Toronto-Dominion Bank and its affiliates, who provide deposit, investment, loan, securities, trust, insurance and other products or services.
TD Direct Investing is a division of TD Waterhouse Canada Inc., a subsidiary of The Toronto-Dominion Bank.
All trademarks are the property of their respective owners.
®The TD logo and other trademarks are the property of The Toronto-Dominion Bank or its subsidiaries.
1 The Global Industry Classification Standard (GICS®) was developed by and/or is the exclusive property of MSCI, Inc. and S&P Global Market Intelligence Inc. (“S&P Global Market S&P GICS Distribution Agreement Intelligence”). GICS is a service mark of MSCI and S&P Global Market Intelligence and has been licensed for use by The Toronto-Dominion Bank.
Footnotes
0 Reported by Investor Economics in the “Online/Discount Brokerage Market Share Report" for the quarter ending June 30, 2021.
1 However, note that TD Direct Investing clients have a broad range of investing sophistication – including some whose trading traits are similar to institutional investors.
2 We have explored a diverse set of proxies (including those from the cited papers). We arrive at the most salient proxies using the 3-step proxy selection process.
3 Insights are observations and not forward-looking. They are subject to change based on future data.
The TD Direct Investing Index (DII) provides data and insights relating to historical self-directed investor activity. The DII is for informational purposes only. Any information provided through the DII should not be considered an investment recommendation, nor is it an offer, or solicitation of an offer to purchase or sell any investment fund, security or other product. Particular investment, trading, or tax strategies should be evaluated relative to each individual’s objectives. Investors should not take the historical information as an indication, assurance, estimate or forecast of future values or future performance. The DII should not be used as individual financial, legal, investment or tax advice. Please consult your own legal, investment and/or tax advisor. Information provided through the DII is subject to change without notice.
The Toronto-Dominion Bank and/or its subsidiaries or affiliated persons or companies may hold a position in the securities mentioned, including options, futures and other derivative instruments thereon, and may, as principal or agent, buy or sell such securities. They may also make a market in, issue, and participate in an underwriting of such securities.
1 The Global Industry Classification Standard (GICS®) was developed by and/or is the exclusive property of MSCI, Inc. and S&P Global Market Intelligence Inc. (“S&P Global Market S&P GICS Distribution Agreement Intelligence”). GICS is a service mark of MSCI and S&P Global Market Intelligence and has been licensed for use by The Toronto-Dominion Bank.
February 2024: Overall self-directed investor sentiment was bullish. Watch this video for market highlights.